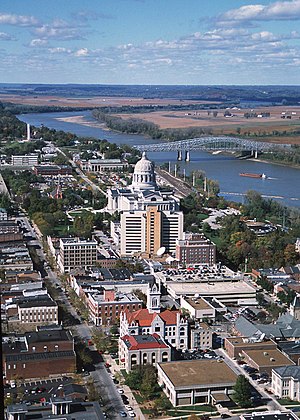
Jefferson City metropolitan area
Jefferson City, Missouri Metropolitan Area
Columbia-Jefferson City-Moberly, MO CSA | |
|---|---|
 Jefferson City and Missouri State Capitol | |
| Motto: Jefferson City | |
 Columbia Combined Statistical Area | |
| Country | |
| State | |
| Largest city | |
| Other cities | |
| Counties | |
| Population (2022)[1] | |
| • MSA | 214,630 (216th) |
| • CSA | 414,036 (102nd) |
| Time zone | UTC−6 (CST) |
| • Summer (DST) | UTC−5 (CDT) |
| Area code(s) | 573, 660 |
The Jefferson City metropolitan statistical area, as defined by the United States Census Bureau, is an area consisting of four counties – Cole, Callaway, Moniteau, and Osage – in central Missouri anchored by the city of Jefferson City. As of the 2020 census, the MSA had a population of 150,316.[2] The Jefferson City MSA consists of four counties, and borders the Columbia metropolitan area to the north.
Counties
| Census | Pop. | Note | %± |
|---|---|---|---|
| 1990 | 120,704 | — | |
| 2000 | 140,052 | 16.0% | |
| 2010 | 149,807 | 7.0% | |
| 2020 | 150,316 | 0.3% | |
| U.S. Decennial Census | |||
Communities
Places with more than 40,000 inhabitants
- Jefferson City (Principal city) Pop: 43,079
Places with 1,000 to 15,000 inhabitants
- Fulton Pop: 12,790
- California Pop: 4,278
- Tipton Pop: 3,262
- Holts Summit Pop: 3,247
- Belle (partial) Pop: 1,545
- Wardsville Pop: 1,506
- Linn Pop: 1,459
- St. Martins Pop: 1,140
Places with less than 1,000 inhabitants
- Auxvasse Pop: 983
- Taos Pop: 878
- Russellville Pop: 807
- New Bloomfield Pop: 669
- Bland (partial) Pop: 539
- Freeburg Pop: 437
- Westphalia Pop: 389
- Chamois Pop: 386
- Jamestown Pop: 386
- Lake Mykee Town Pop: 350
- Clarksburg Pop: 334
- Centertown Pop: 278
- St. Thomas Pop: 263
- Meta Pop: 229
- Lohman Pop: 163
- Argyle (partial) Pop: 162
- Kingdom City Pop: 128
- Mokane Pop: 125
- Lupus Pop: 33
Unincorporated places
- Bonnots Mill
- Cedar City
- Elston
- Eugene
- Folk
- Fortuna
- Frankenstein
- Henley
- High Point
- Koeltztown
- Latham
- Loose Creek
- McGirk
- Portland
- Rich Fountain
- Tebbetts
- Williamsburg
Demographics
As of the census[3] of 2000, there were 140,052 people, 51,637 households, and 35,569 families residing within the MSA. The racial makeup of the MSA was 90.12% White, 7.12% African American, 0.38% Native American, 0.64% Asian, 0.03% Pacific Islander, 0.52% from other races, and 1.19% from two or more races. Hispanic or Latino of any race were 1.29% of the population.
The median income for a household in the MSA was $39,692, and the median income for a family was $46,720. Males had a median income of $29,922 versus $22,678 for females. The per capita income for the MSA was $17,900.
See also
References
- ^ "U.S. Census website". Retrieved March 6, 2023.
- ^ "Metropolitan and Micropolitan Statistical Areas Population Totals: 2020-2023". Census.gov. Retrieved March 19, 2024.
- ^ "U.S. Census website". United States Census Bureau. Retrieved January 31, 2008.
