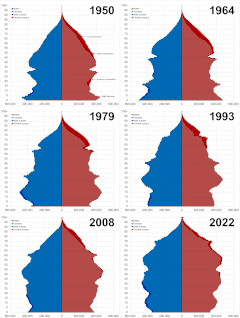
File:UK population pyramid from 1950 to 2020.gif
Appearance

Size of this preview: 677 × 599 pixels. Other resolutions: 271 × 240 pixels | 542 × 480 pixels | 868 × 768 pixels | 1,200 × 1,062 pixels.
Original file (1,200 × 1,062 pixels, file size: 3.16 MB, MIME type: image/gif, looped, 73 frames, 16 s)
File history
Click on a date/time to view the file as it appeared at that time.
| Date/Time | Thumbnail | Dimensions | User | Comment | |
|---|---|---|---|---|---|
| current | 00:01, 22 October 2022 |  | 1,200 × 1,062 (3.16 MB) | Tweedle | Vastly improved version, now shows 1; surplus population, 2; start of each generation cohort |
| 19:49, 3 September 2022 |  | 1,200 × 1,053 (2.04 MB) | Tweedle | fixed mistake in the gif - previous version did not have 1955 and skipped straight to 1956 after 1954 | |
| 13:10, 2 September 2022 |  | 1,200 × 1,053 (2.02 MB) | Tweedle | new version, goes up in single year brackets and goes up to 2022 instead of 2020 | |
| 16:20, 26 July 2022 |  | 1,200 × 1,162 (572 KB) | Tweedle | missed 1970 on the gif | |
| 16:18, 26 July 2022 |  | 1,200 × 1,162 (548 KB) | Tweedle | Uploaded own work with UploadWizard |
File usage
The following 3 pages use this file:
