1959 Japanese House of Councillors election
Appearance
(Redirected from Japanese House of Councillors election, 1959)
| |||||||||||||||||||||||||||||||||||||||||||||||||||||||||||
127 of the 250 seats in the House of Councillors 126 seats needed for a majority | |||||||||||||||||||||||||||||||||||||||||||||||||||||||||||
|---|---|---|---|---|---|---|---|---|---|---|---|---|---|---|---|---|---|---|---|---|---|---|---|---|---|---|---|---|---|---|---|---|---|---|---|---|---|---|---|---|---|---|---|---|---|---|---|---|---|---|---|---|---|---|---|---|---|---|---|
| |||||||||||||||||||||||||||||||||||||||||||||||||||||||||||
| |||||||||||||||||||||||||||||||||||||||||||||||||||||||||||
| This article is part of a series on |
 |
|---|
|
|
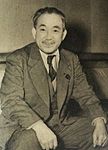
House of Councillors elections were held in Japan on 2 June 1959,[1] electing half the seats in the House. The Liberal Democratic Party won the most seats. Kōji Harashima, who later become a founding member and the first chairman of Kōmeitō, was elected to the Diet for the first time as one of several Soka Gakkai-affiliated independents.
During the campaign, Prime Minister Nobusuke Kishi and MITI began to discuss the now-famous "income doubling" plan, although it was temporarily shelved due to disputes between party factions and the looming importance of the US–Japan Security Treaty revision issue. The plan would not be revived until the tenure of Hayato Ikeda, beginning in 1960.[2]
Results
[edit] | ||||||||||||
|---|---|---|---|---|---|---|---|---|---|---|---|---|
| Party | National | Constituency | Seats | |||||||||
| Votes | % | Seats | Votes | % | Seats | Not up | Won | Total after | +/– | |||
| Liberal Democratic Party | 12,120,598 | 41.20 | 22 | 15,667,022 | 52.00 | 49 | 61 | 71 | 132 | +10 | ||
| Japan Socialist Party | 7,794,754 | 26.49 | 17 | 10,265,394 | 34.07 | 21 | 47 | 38 | 85 | +5 | ||
| Ryokufūkai | 2,382,703 | 8.10 | 4 | 731,383 | 2.43 | 2 | 5 | 6 | 11 | –20 | ||
| Political League for Small and Medium Enterprises | 598,519 | 2.03 | 1 | 0 | 1 | 1 | New | |||||
| Japanese Communist Party | 551,916 | 1.88 | 1 | 999,255 | 3.32 | 0 | 2 | 1 | 3 | +1 | ||
| Other parties | 154,743 | 0.53 | 0 | 155,189 | 0.52 | 0 | 0 | 0 | 0 | 0 | ||
| Independents | 5,817,187 | 19.77 | 7 | 2,311,112 | 7.67 | 3 | 8 | 10 | 18 | +4 | ||
| Total | 29,420,420 | 100.00 | 52 | 30,129,355 | 100.00 | 75 | 123 | 127 | 250 | 0 | ||
| Valid votes | 29,420,420 | 93.59 | 30,129,355 | 95.83 | ||||||||
| Invalid/blank votes | 2,016,244 | 6.41 | 1,310,398 | 4.17 | ||||||||
| Total votes | 31,436,664 | 100.00 | 31,439,753 | 100.00 | ||||||||
| Registered voters/turnout | 53,516,473 | 58.74 | 53,516,473 | 58.75 | ||||||||
| Source: Ministry of Internal Affairs and Communications,[1][3] National Diet | ||||||||||||
By constituency
[edit]| Prefecture | Total seats |
Seats won | |||||
|---|---|---|---|---|---|---|---|
| LDP | JSP | Ryokufūkai | JCP | PLSME | Ind. | ||
| Aichi | 3 | 2 | 1 | ||||
| Akita | 1 | 1 | |||||
| Aomori | 1 | 1 | |||||
| Chiba | 2 | 1 | 1 | ||||
| Ehime | 1 | 1 | |||||
| Fukui | 1 | 1 | |||||
| Fukuoka | 3 | 2 | 1 | ||||
| Fukushima | 2 | 1 | 1 | ||||
| Gifu | 1 | 1 | |||||
| Gunma | 2 | 1 | 1 | ||||
| Hiroshima | 2 | 1 | 1 | ||||
| Hokkaido | 4 | 2 | 2 | ||||
| Hyōgo | 3 | 2 | 1 | ||||
| Ibaraki | 2 | 1 | 1 | ||||
| Ishikawa | 1 | 1 | |||||
| Iwate | 1 | 1 | |||||
| Kagawa | 1 | 1 | |||||
| Kagoshima | 2 | 2 | |||||
| Kanagawa | 2 | 1 | 1 | ||||
| Kōchi | 1 | 1 | |||||
| Kumamoto | 2 | 2 | |||||
| Kyoto | 2 | 1 | 1 | ||||
| Mie | 1 | 1 | |||||
| Miyagi | 1 | 1 | |||||
| Miyazaki | 1 | 1 | |||||
| Nagano | 2 | 1 | 1 | ||||
| Nagasaki | 1 | 1 | |||||
| Nara | 1 | 1 | |||||
| Niigata | 2 | 1 | 1 | ||||
| Ōita | 1 | 1 | |||||
| Okayama | 2 | 1 | 1 | ||||
| Osaka | 3 | 1 | 2 | ||||
| Saga | 1 | 1 | |||||
| Saitama | 2 | 1 | 1 | ||||
| Shiga | 1 | 1 | |||||
| Shimane | 1 | 1 | |||||
| Shizuoka | 2 | 2 | |||||
| Tochigi | 2 | 1 | 1 | ||||
| Tokushima | 1 | 1 | |||||
| Tokyo | 4 | 2 | 2 | ||||
| Tottori | 1 | 1 | |||||
| Toyama | 1 | 1 | |||||
| Wakayama | 1 | 1 | |||||
| Yamagata | 1 | 1 | |||||
| Yamaguchi | 1 | 1 | |||||
| Yamanashi | 1 | 1 | |||||
| National | 52 | 22 | 17 | 4 | 1 | 1 | 7 |
| Total | 127 | 71 | 38 | 6 | 7 | 7 | 10 |
References
[edit]- ^ a b Table 13: Persons Elected and Votes Polled by Political Parties - Ordinary Elections for the House of Councillors (1947–2004) Archived 2011-03-23 at the Wayback Machine Ministry of Internal Affairs and Communications
- ^ Fukui, Haruhiro (1972). "Economic Planning in Postwar Japan: A Case Study in Policy Making". Asian Survey. 12 (4): 341–342. doi:10.2307/2642940. ISSN 0004-4687.
- ^ "27-11 Allotted Number, Candidates, Eligible Voters as of Election Day, Voters and Voting Percentages of Ordinary Elections for the House of Councillors (1947-2004)". Ministry of Internal Affairs and Communications. Archived from the original on 2006-01-04.


