1868 United States presidential election in Louisiana
| ||||||||||||||||||||||||||
| ||||||||||||||||||||||||||
 Parish Results
| ||||||||||||||||||||||||||
| ||||||||||||||||||||||||||
| Elections in Louisiana |
|---|
 |
|
|
The 1868 United States presidential election in Louisiana took place on November 3, 1868, as part of the 1868 United States presidential election. Voters chose seven representatives, or electors to the Electoral College, who voted for president and vice president.
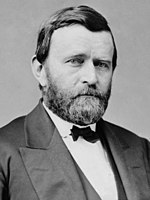
Louisiana voted for the Democratic nominee, former Governor of New York Horatio Seymour, over the Republican nominee, General Ulysses S. Grant. Seymour won the state by a margin of 41.38%.
With 70.69% of the popular vote, Louisiana would be Seymour's second strongest victory in terms of percentage in the popular vote after Kentucky.[1]
As of 2024, this remains the only time that Louisiana has voted Democratic while neighboring Arkansas voted Republican.
Results
[edit]| Party | Candidate | Votes | % | |
|---|---|---|---|---|
| Democratic | Horatio Seymour | 80,225 | 70.69% | |
| Republican | Ulysses S. Grant | 33,263 | 29.31% | |
| Total votes | 113,488 | 100% | ||
Results By Parish
[edit]| Parish | Horatio Seymour
Democratic |
Ulysses S. Grant
Republican |
Total Votes Cast | ||
|---|---|---|---|---|---|
| # | % | # | % | ||
| Ascension | 1,125 | 43.00% | 1,491 | 57.00% | 2,616 |
| Assumption | 1,375 | 49.78% | 1,387 | 50.22% | 2,762 |
| Avoyelles | 1,345 | 72.12% | 520 | 27.88% | 1,865 |
| Bienville | 1,385 | 99.93% | 1 | 0.07% | 1,386 |
| Bossier | 1,634 | 99.94% | 1 | 0.06% | 1,635 |
| Caddo | 2,895 | 99.97% | 1 | 0.03% | 2,896 |
| Calcasieu | 782 | 98.86% | 9 | 1.14% | 791 |
| Catahoula | 809 | 84.36% | 150 | 15.64% | 959 |
| Caldwell | 503 | 94.73% | 28 | 5.27% | 531 |
| Carroll | 786 | 36.09% | 1,392 | 63.91% | 2,178 |
| Claiborne | 2,952 | 99.93% | 2 | 0.07% | 2,954 |
| Concordia | 201 | 11.45% | 1,554 | 88.55% | 1,755 |
| DeSoto | 1,260 | 100.00% | 0 | 0.00% | 1,260 |
| East Baton Rouge | 1,350 | 51.98% | 1,247 | 48.02% | 2,597 |
| East Feliciana | 1,411 | 68.66% | 644 | 31.34% | 2,055 |
| Franklin | 1,213 | 100.00% | 0 | 0.00% | 1,213 |
| Iberville | 704 | 25.21% | 2,088 | 74.79% | 2,792 |
| Jackson | 1,398 | 100.00% | 0 | 0.00% | 1,398 |
| Jefferson | 2,222 | 76.78% | 672 | 23.22% | 2,894 |
| Lafourche | 1,796 | 52.62% | 1,617 | 47.38% | 3,413 |
| Livingston | 670 | 81.81% | 149 | 18.19% | 819 |
| Lafayette | 1,422 | 100.00% | 0 | 0.00% | 1,422 |
| Madison | 163 | 89.91% | 1,453 | 10.09% | 1,616 |
| Morehouse | 1,525 | 99.93% | 1 | 0.07% | 1,526 |
| Natchitoches | 1,375 | 41.79% | 1,915 | 58.21% | 3,290 |
| Orleans | 24,668 | 95.44% | 1,178 | 4.56% | 25,846 |
| Ouachita | 1,101 | 56.96% | 832 | 43.04% | 1,933 |
| Pointe Coupee | 896 | 36.59% | 1,553 | 63.41% | 2,449 |
| Plaquemines | 273 | 17.04% | 1,329 | 82.96% | 1,602 |
| Rapides | 1,623 | 42.72% | 2,176 | 57.28% | 3,799 |
| Sabine | 934 | 99.79% | 2 | 0.21% | 936 |
| St. Bernard | 473 | 99.79% | 1 | 0.21% | 474 |
| St. Charles | 264 | 16.51% | 1,335 | 83.49% | 1,599 |
| St. Helena | 1,094 | 88.94% | 136 | 11.06% | 1,230 |
| St. John the Baptist | 556 | 66.99% | 274 | 33.01% | 830 |
| St. James | 775 | 26.40% | 2,161 | 73.60% | 2,936 |
| St. Landry | 4,787 | 100.00% | 0 | 0.00% | 4,787 |
| St. Martin | 1,456 | 98.11% | 28 | 1.89% | 1,484 |
| St. Mary | 1,819 | 61.43% | 1,142 | 38.57% | 2,961 |
| St. Tammany | 704 | 59.97% | 470 | 40.03% | 1,174 |
| Tensas | 383 | 27.34% | 1,018 | 72.66% | 1,401 |
| Terrebonne | 1,296 | 45.68% | 1,541 | 54.32% | 2,837 |
| Union | 1,416 | 99.93% | 1 | 0.07% | 1,417 |
| Vermilion | 958 | 100.00% | 0 | 0.00% | 958 |
| Washington | 656 | 100.00% | 0 | 0.00% | 656 |
| West Baton Rouge | 433 | 42.53% | 585 | 57.47% | 1,018 |
| West Feliciana | 648 | 36.32% | 1,136 | 63.68% | 1,784 |
| Winn | 711 | 94.30% | 43 | 5.70% | 754 |
| Total | 80,225 | 70.69% | 33,263 | 29.31% | 113,488 |
See also
[edit]References
[edit]- ^ "1868 Presidential Election Statistics". Dave Leip’s Atlas of U.S. Presidential Elections. Retrieved March 5, 2018.
- ^ "1868 Presidential General Election Results - Louisiana".
- ^ "Our Campaigns - LA US President Race - Nov 03, 1868". www.ourcampaigns.com. Retrieved September 5, 2024.


