1955 Tasmanian state election
| ||||||||||||||||||||||||||||||||||
All 30 seats to the House of Assembly | ||||||||||||||||||||||||||||||||||
|---|---|---|---|---|---|---|---|---|---|---|---|---|---|---|---|---|---|---|---|---|---|---|---|---|---|---|---|---|---|---|---|---|---|---|
| ||||||||||||||||||||||||||||||||||
 Results of the election | ||||||||||||||||||||||||||||||||||
| ||||||||||||||||||||||||||||||||||
The 1955 Tasmanian state election was held on 19 February 1955 in the Australian state of Tasmania to elect 30 members of the Tasmanian House of Assembly. The election used the Hare-Clark proportional representation system[1] — six members were elected from each of five electorates.
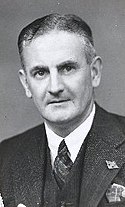
The incumbent Labor government, led by Robert Cosgrove, had been in office continuously since 1934, although had not held a majority since 1946. It was looking to win another term in minority government against the opposition Liberal Party, on this occasion led by Rex Townley.
The election resulted in a parliamentary deadlock, with both the Labor and Liberal parties winning 15 seats in the 30 seat assembly.
The 1955 election also saw the first women elected to the House of Assembly: Mabel Miller for Franklin and Amelia Best for Wilmot, both members of the Liberal Party.[2]
Results
[edit] | ||||||
|---|---|---|---|---|---|---|
| Party | Votes | % | +/– | Seats | +/– | |
| Labor | 82,362 | 52.63 | +4.00 | 15 | ||
| Liberal | 70,959 | 45.35 | -2.23 | 15 | ||
| Independents | 3,158 | 2.02 | -1.72 | 0 | ||
| Total | 156,479 | 100.00 | – | 30 | – | |
| Valid votes | 156,479 | 96.21 | ||||
| Invalid/blank votes | 6,158 | 3.79 | -0.69 | |||
| Total votes | 162,637 | 100.00 | – | |||
| Registered voters/turnout | 173,165 | 93.92 | -0.60 | |||
Distribution of votes
[edit]Primary vote by division
[edit]| Bass | Braddon | Denison | Franklin | Wilmot | |
|---|---|---|---|---|---|
| Labor Party | 53.5% | 53.3% | 50.8% | 49.9% | 55.7% |
| Liberal Party | 46.0% | 46.7% | 42.5% | 46.5% | 44.3% |
| Other | 0.5% | — | 6.7% | 3.5% | — |
Distribution of seats
[edit]See also
[edit]- Members of the Tasmanian House of Assembly, 1955–1956
- Candidates of the 1955 Tasmanian state election
References
[edit]External links
[edit]- Assembly Election Results, 1955, Parliament of Tasmania.
- Report on Parliamentary Elections, 1955, Tasmanian Electoral Commission.


