
User:Onetwothreeip/Opinion polling for the 2024 Republican Party presidential primaries
2024 U.S. presidential election | |
|---|---|
|
|
| Democratic Party | |
| Republican Party | |
| Third parties | |
| Related races | |
| |
This is a list of nationwide and statewide public opinion polls that have been conducted relating to the Republican primaries for the 2024 United States presidential election. The persons named in the polls are declared candidates or have received media speculation about their possible candidacy. The polls included are among Republicans or Republicans and Republican-leaning independents. If multiple versions of polls are provided, the version among likely voters is prioritized, then registered voters, then adults.
Background[edit]

| Active campaign | Exploratory committee | Withdrawn candidate | Republican National Convention | ||||
| Midterm elections | Debates | Primaries |
Nationwide polling[edit]

- Aggregate polls
| Source of poll aggregation |
Dates administered |
Dates updated |
Doug Burgum |
Chris Christie |
Ron DeSantis |
Larry Elder |
Nikki Haley |
Will Hurd |
Asa Hutchinson |
Perry Johnson |
Mike Pence |
Vivek Ramaswamy |
Tim Scott |
Donald Trump |
Other/ Undecided[a] |
Margin |
|---|---|---|---|---|---|---|---|---|---|---|---|---|---|---|---|---|
| 270 to Win | September 15–26, 2023 | September 28, 2023 | 0.4% | 2.4% | 15.6% | 0.0% | 7.0% | 0.0% | 0.6% | – | 4.6% | 4.6% | 3.4% | 56.0% | 5.4% | 40.4% |
| Race to the WH | July 21 – September 28, 2023 | September 29, 2023 | 0.5% | 2.6% | 13.4% | 0.4% | 5.6% | 0.5% | 0.4% | 0.4% | 4.1% | 6.7% | 2.7% | 55.5% | 7.2% | 42.1% |
| Real Clear Politics | September 13–28, 2023 | September 29, 2023 | 0.9% | 2.7% | 14.0% | – | 5.8% | – | 0.6% | – | 4.1% | 5.3% | 2.8% | 57.1% | 6.7% | 43.1% |
| FiveThirtyEight | July 19 – September 28, 2023 | September 29, 2023 | 1.0% | 2.7% | 13.5% | – | 6.5% | 0.4% | 0.7% | – | 4.0% | 6.6% | 2.7% | 55.1% | 6.8% | 41.6% |
| Average | 0.7% | 2.6% | 14.1% | 0.2% | 6.2% | 0.3% | 0.6% | 0.4% | 4.2% | 5.8% | 2.9% | 55.9% | 6.1% | 41.8% | ||
| Poll source | Date(s) administered | Sample size[b] | Doug Burgum |
Chris Christie |
Ron DeSantis |
Larry Elder |
Nikki Haley |
Will Hurd |
Asa Hutchinson |
Perry Johnson |
Mike Pence |
Vivek Ramaswamy |
Tim Scott |
Francis Suarez |
Donald Trump |
Other/ Undecided |
|---|---|---|---|---|---|---|---|---|---|---|---|---|---|---|---|---|
| Léger/New York Post | September 27–28, 2023 | 495 (LV) | 1% | 0% | 10% | – | 6% | – | – | – | 3% | 7% | 3% | – | 62% | 9%[c] |
| The second Republican National Debate is held between Doug Burgum, Chris Christie, Ron DeSantis, Nikki Haley, Mike Pence, Vivek Ramaswamy, and Tim Scott. | ||||||||||||||||
| YouGov/The Economist | September 23–26, 2023 | 559 (A) | 0% | 2% | 12% | 0% | 7% | 0% | 0% | – | 5% | 5% | 3% | – | 51% | 15%[d] |
| McLaughlin & Associates | September 22–26, 2023 | 454 (LV) | 1% | 2% | 12% | 0% | 6% | 1% | 1% | 1% | 5% | 10% | 2% | – | 54% | 6%[e] |
| Morning Consult | September 22–24, 2023 | 3,552 (LV) | 1% | 2% | 15% | – | 7% | 0% | 1% | – | 6% | 9% | 2% | – | 58% | 1%[f] |
| Monmouth University | September 19–24, 2023 | 514 (RV) | 0% | 1% | 15% | – | 6% | – | 0% | – | 1% | 4% | 3% | – | 48% | 23%[g] |
| Trafalgar Group | September 18–21, 2023 | 1,091 (LV) | 3.2% | 3.2% | 14.3% | 1.3% | 4.2% | 0.1% | 0.4% | 1.1% | 3.8% | 5.9% | 3.0% | – | 56.1% | 3.3%[h] |
| ABC News/Washington Post | September 15–20, 2023 | 474 (A) | 0% | 3% | 15% | – | 7% | – | 0% | – | 6% | 3% | 4% | – | 54% | 10%[i] |
| NBC News | September 15–19, 2023 | 321 (RV) | 0% | 4% | 16% | – | 7% | – | 1% | – | 4% | 2% | 3% | – | 59% | 4%[j] |
| HarrisX/The Messenger | September 13–19, 2023 | 1,089 (RV) | 1% | 2% | 14% | 1% | 5% | 1% | 1% | 0% | 3% | 5% | 2% | 0% | 56% | 10%[k] |
| Emerson College | September 17–18, 2023 | 518 (LV) | 1.1% | 4.8% | 11.5% | – | 3.0% | 1.3% | 0.5% | 0.1% | 4.6% | 6.8% | 2.2% | – | 58.9% | 5.2%[l] |
| YouGov | September 14–18, 2023 | 470 (RV) | 1% | 1% | 13% | 0% | 5% | – | 0% | – | 3% | 5% | 1% | – | 59% | 11%[m] |
| YouGov/The Liberal Patriot | September 7–18, 2023 | 1,653 (LV) | 1% | 6% | 14% | 1% | 8% | – | 1% | – | 5% | 5% | 4% | – | 48% | 7%[n] |
| Morning Consult | September 15–17, 2023 | 3,404 (LV) | 0% | 2% | 13% | – | 6% | 0% | 1% | – | 5% | 10% | 2% | – | 59% | 1%[o] |
| Harvard/Harris[A] | September 13–14, 2023 | 758 (RV) | 0% | 2% | 10% | 1% | 6% | 0% | 0% | 1% | 4% | 8% | 2% | – | 57% | 10%[p] |
| Ipsos/Reuters | September 8–14, 2023 | 1,749 (A) | 0% | 2% | 14% | – | 4% | 0% | 0% | – | 4% | 13% | 2% | – | 51% | 10%[q] |
| YouGov/The Economist | September 10–12, 2023 | 572 (A) | 0% | 2% | 14% | 0% | 5% | 0% | 0% | – | 5% | 6% | 3% | – | 52% | 12%[r] |
| Fox News | September 9–12, 2023 | 409 (LV) | – | 2% | 13% | – | 5% | – | – | – | 3% | 11% | 3% | – | 60% | 2% |
| Quinnipiac University | September 7–11, 2023 | 728 (RV) | – | 2% | 12% | – | 5% | – | – | – | 5% | 6% | 3% | – | 62% | 4%[s] |
| HarrisX/The Messenger | September 6–11, 2023 | 954 (RV) | 0% | 2% | 11% | 1% | 4% | 1% | 0% | 1% | 4% | 7% | 2% | 0% | 59% | 8%[t] |
| Morning Consult | September 8–10, 2023 | 3,715 (LV) | 0% | 3% | 14% | – | 6% | 0% | 0% | – | 6% | 9% | 2% | – | 57% | 1%[u] |
| Premise | August 30 – September 5, 2023 | 415 (RV) | – | 1% | 12% | – | 5% | – | – | – | 7% | 5% | 2% | – | 62% | 7%[v] |
| Rasmussen | August 29 – September 5, 2023 | 1,418 (LV) | 0% | 9% | 9% | 1% | 7% | 0% | 0% | 0% | 4% | 5% | 4% | 0% | 45% | 0%[w] |
| Redfield & Wilton Strategies | September 3–4, 2023 | 605 (LV) | 0% | 3% | 9% | – | 2% | – | 1% | 0% | 3% | 10% | 1% | 0% | 65% | 6% |
| Morning Consult | September 2–4, 2023 | 3,745 (LV) | 0% | 3% | 15% | – | 5% | 0% | 1% | – | 6% | 8% | 2% | – | 60% | 1%[x] |
| I&I/TIPP | August 30 – September 1, 2023 | 509 (RV) | 0.4% | 1% | 11% | 0.87% | 2.8% | 0% | 0.4% | – | 6% | 9% | 1.3% | – | 60% | 15%[y] |
| Echelon Insights | August 28–31, 2023 | 397 (LV) | 0% | 3% | 15% | 1% | 4% | 0% | 1% | – | 6% | 12% | 1% | 0% | 52% | 6%[z] |
| SSRS/CNN | August 25–31, 2023 | 784 (RV) | 1% | 2% | 18% | 1% | 7% | 0% | 0% | 0% | 7% | 6% | 3% | 0% | 52% | 2%[aa] |
| Wall Street Journal | August 24–30, 2023 | 600 (LV) | 1% | 3% | 13% | 0% | 8% | 0% | 1% | 0% | 2% | 5% | 2% | 0% | 59% | 4%[ab] |
| Morning Consult | August 29, 2023 | 3,617 (LV) | 0% | 3% | 14% | – | 5% | 0% | 1% | – | 6% | 10% | 2% | 0% | 58% | 1%[ac] |
| YouGov/The Economist | August 26–29, 2023 | 562 (A) | 0% | 2% | 14% | 0% | 4% | 0% | 0% | – | 3% | 5% | 2% | 0% | 51% | 18%[ad] |
| Francis Suarez withdraws from the race. | ||||||||||||||||
| FairVote/WPA Intelligence | August 24–28, 2023 | 800 (LV) | 0.7% | 4.8% | 18.5% | 0.0% | 8.5% | 0.7% | 0.5% | – | 5.7% | 6.9% | 3.6% | 0.3% | 49.3% | 0.4%[ae] |
| HarrisX/The Messenger | August 24–28, 2023 | 685 (RV) | 0% | 2% | 14% | 0% | 3% | 0% | 0% | 0% | 6% | 8% | 2% | 0% | 59% | 6%[af] |
| Big Village | August 25–27, 2023 | 722 (A) | 0.6% | 1.7% | 14.0% | 0.4% | 5.1% | – | 0.9% | 1.2% | 6.4% | 8.8% | 1.9% | – | 56.8% | 2%[ag] |
| Emerson College | August 25–26, 2023 | 460 (LV) | 0.6% | 5.2% | 11.6% | – | 6.5% | 0.3% | 0.6% | 0.4% | 6.9% | 8.8% | 1.6% | 0.3% | 49.6% | 7.6%[ah] |
| Ipsos/Reuters | August 24–25, 2023 | 347 (A) | 0% | 1% | 13% | – | 4% | 1% | 0% | – | 6% | 5% | 1% | 0% | 52% | 16%[ai] |
| Kaplan Strategies | August 24, 2023 | 844 (LV) | 2% | 4% | 10% | – | 8% | – | 1% | – | 5% | 13% | 4% | – | 45% | 8%[aj] |
| Morning Consult | August 24, 2023 | 1,256 (LV) | 0% | 4% | 14% | – | 3% | 0% | 0% | – | 6% | 11% | 3% | 0% | 58% | 1%[ak] |
| Patriot Polling | August 24, 2023 | 750 (RV) | 4.3% | 6.2% | 21.0% | – | 12.6% | – | 1.0% | – | 5.4% | 5.1% | 3.5% | – | 40.6% | 3.8%[al] |
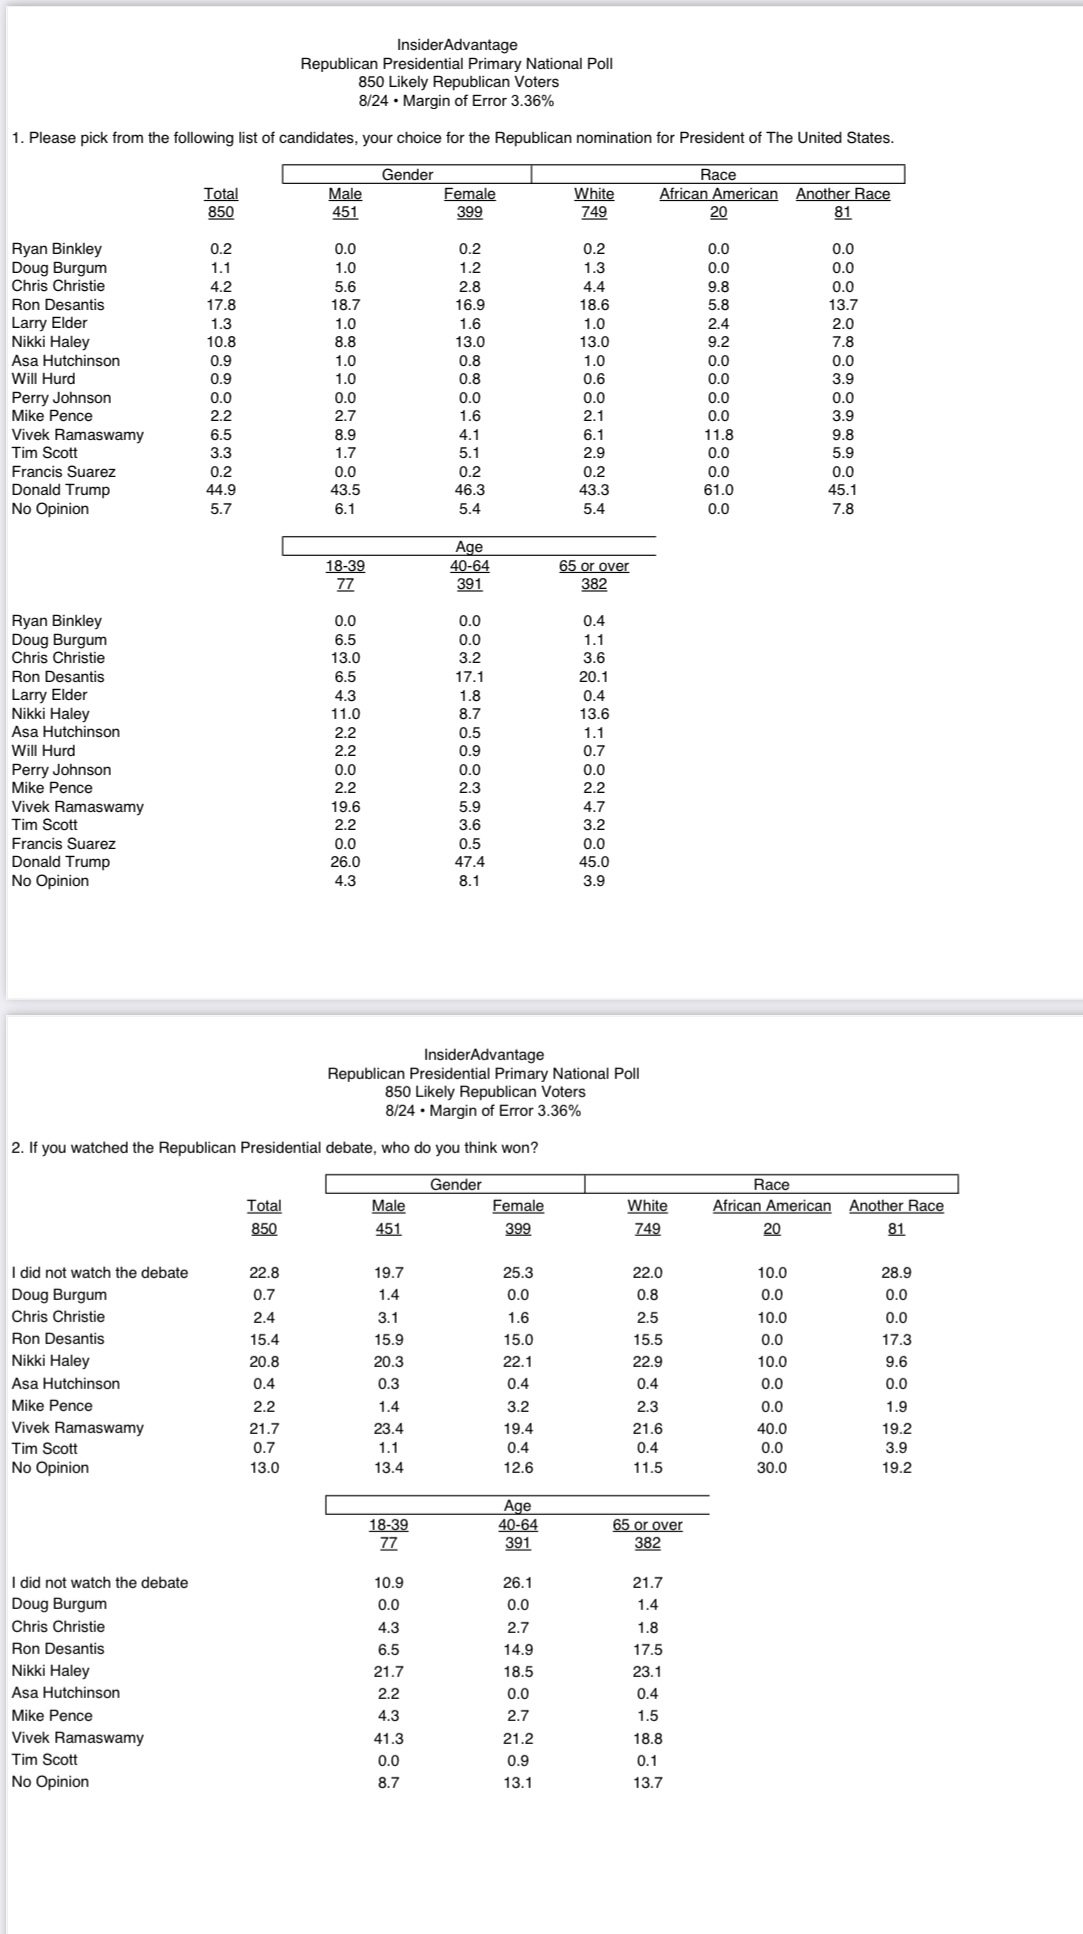
| InsiderAdvantage | August 24, 2023 | 850 (LV) | 1.1% | 4.2% | 17.8% | 1.3% | 10.8% | 0.9% | 0.9% | 0% | 2.2% | 6.5% | 3.3% | 0.2% | 44.9% | 5.9%[am] |
| Léger/New York Post | August 23–24, 2023 | 658 (RV) | – | 1% | 9% | – | 2% | 0% | – | – | 5% | 5% | 3% | – | 61% | 11%[an] |
| The first Republican National Debate is held between Doug Burgum, Chris Christie, Ron DeSantis, Nikki Haley, Asa Hutchinson, Mike Pence, Vivek Ramaswamy, and Tim Scott. | ||||||||||||||||
| McLaughlin & Associates | August 15–23, 2023 | 450 (LV) | 1% | 4% | 9% | 1% | 3% | 0% | 1% | 0% | 4% | 13% | 4% | 0% | 51% | 11%[ao] |
| Rasmussen | August 19–21, 2023 | 818 (LV) | 0% | 7% | 10% | 1% | 3% | 0% | 1% | 0% | 3% | 11% | 4% | 0% | 49% | 0%[ap] |
| Yahoo News/YouGov | August 17–21, 2023 | 482 (RV) | 1% | 2% | 12% | 0% | 3% | – | 0% | – | 2% | 8% | 4% | 0% | 52% | 16%[aq] |
| Premise | August 17–21, 2023 | 463 (A) | – | 1% | 15% | – | 2% | – | – | – | 4% | 5% | 3% | – | 63% | 8%[ar] |
| HarrisX | August 17–21, 2023 | 1,057 (LV) | 0% | 3% | 12% | 0% | 3% | 0% | 1% | 0% | 4% | 10% | 4% | 0% | 52% | 12%[as] |
| Insider Advantage | August 19–20, 2023 | 750 (LV) | 1.2% | 4.2% | 9.7% | 1.6% | 4.8% | 1.1% | 1.5% | 0.6% | 3.3% | 6.3% | 3.3% | 0.1% | 50.6% | 11.7%[at] |
| Morning Consult | August 18–20, 2023 | 3,608 (LV) | 0% | 3% | 14% | – | 3% | 0% | 1% | – | 6% | 10% | 3% | 0% | 58% | 1%[au] |
| YouGov/CBS News | August 16–18, 2023 | 531 (LV) | 1% | 2% | 16% | 0% | 2% | 0% | 1% | – | 5% | 7% | 3% | 0% | 62% | – |
| Emerson College | August 16–17, 2023 | 465 (LV) | 1.1% | 2.8% | 10.1% | 0.8% | 1.9% | 0.7% | 0.8% | 0.3% | 3.4% | 9.5% | 2.4% | – | 55.5% | 10.8%[av] |
| Echelon Insights[B] | August 15–17, 2023 | 1,017 (LV) | – | 1% | 12% | – | 3% | – | – | – | 4% | 15% | 3% | – | 55% | – |
| 3D Strategic Research | August 15–17, 2023 | 858 (LV) | 0% | 5% | 16% | 0% | 4% | 0% | 0% | 0% | 6% | 9% | 3% | 0% | 50% | 6%[aw] |
| Victory Insights | August 15–17, 2023 | 825 (LV) | – | 5.9% | 12.1% | – | 1.9% | – | – | 1.1% | 3.5% | 3.7% | 1.2% | – | 60.8% | 9.9%[ax] |
| JMC Analytics | August 14–17, 2023 | 1,100 (LV) | 0.9% | 4.5% | 13.0% | – | 3.4% | 0.4% | 1.2% | 0.1% | 3.5% | 5.0% | 4.1% | 0.3% | 52.0% | 12%[ay] |
| Kaplan Strategies | August 15–16, 2023 | 1,093 (LV) | 1% | 3% | 10% | – | 5% | – | 3% | – | 6% | 11% | 3% | 2% | 47% | 9%[az] |
| American Pulse | August 15–16, 2023 | 821 (LV) | – | 4.0% | 13.0% | – | 3.0% | – | – | – | 4.0% | 7.1% | 3.5% | – | 58.0% | – |
| Trafalgar Group | August 14–16, 2023 | 1,082 (LV) | 0.1% | 4.6% | 17.0% | 1.2% | 4.2% | 0.3% | 0.9% | 1.1% | 4.6% | 4.3% | 4.0% | 0.1% | 55.4% | 2.2%[ba] |
| The Economist/YouGov | August 12–15, 2023 | 527 (RV) | 0% | 2% | 15% | 0% | 2% | 0% | 0% | – | 3% | 4% | 3% | 0% | 53% | 16%[bb] |
| Donald Trump is indicted by a Georgia grand jury for his alleged efforts to overturn the results of the 2020 presidential election in Georgia. | ||||||||||||||||
| Fox News/Beacon Research | August 12–14, 2023 | 413 (RV) | 1% | 3% | 16% | 0% | 4% | 0% | 0% | 0% | 5% | 11% | 3% | 0% | 53% | – |
| RMG Research | August 11–14, 2023 | 229 (LV) | – | 5% | 8% | – | 4% | – | – | – | 4% | 13% | 2% | – | 60% | – |
| Quinnipiac University | August 10–14, 2023 | 681 (RV) | 0% | 3% | 18% | 0% | 3% | 1% | 1% | 0% | 4% | 5% | 3% | 0% | 57% | 5%[bc] |
| Morning Consult | August 11–13, 2023 | 3,064 (LV) | 1% | 3% | 16% | – | 3% | 0% | 1% | – | 7% | 9% | 3% | 1% | 57% | 1%[bd] |
| Kaplan Strategies | August 9–10, 2023 | 800 (LV) | 1% | 4% | 10% | – | 4% | – | 0% | – | 8% | 11% | 2% | – | 48% | 13%[be] |
| Premise | August 2–7, 2023 | 484 (A) | – | 2% | 16% | – | 3% | – | – | – | 6% | 6% | 3% | – | 57% | 6%[bf] |
| Fairleigh Dickinson University | July 31 – August 7, 2023 | 806 (LV) | 1% | 5% | 15% | 0% | 3% | 0% | 0% | – | 5% | 3% | 2% | – | 58% | 6%[bg] |
| Morning Consult | August 4–6, 2023 | 3,486 (LV) | 0% | 3% | 16% | – | 3% | 0% | 1% | – | 6% | 8% | 3% | 0% | 59% | 1%[bh] |
| I&I/TIPP | August 2–4, 2023 | 529 (RV) | 0% | 0% | 12% | 0% | 4% | – | 0% | – | 5% | 8% | 2% | – | 57% | 10%[bi] |
| Reuters/Ipsos | August 2–3, 2023 | 355 (A) | 0% | 0% | 13% | – | 5% | 0% | 1% | – | 8% | 7% | 2% | 0% | 47% | 17%[bj] |
| Cygnal | August 1–3, 2023 | (LV) | 0.2% | 2.1% | 10.4% | 0.2% | 2.8% | – | 0.3% | 0.0% | 6.6% | 11.4% | 3.2% | 0.6% | 53.3% | 9%[bk] |
| Donald Trump is indicted by a federal grand jury for his alleged efforts to overturn the results of the 2020 presidential election. | ||||||||||||||||
| Morning Consult | July 28–30, 2023 | 3,716 (LV) | 1% | 3% | 15% | – | 3% | 1% | 0% | – | 7% | 9% | 3% | 0% | 58% | 1%[bl] |
| Echelon Insights | July 24–27, 2023 | 399 (LV) | 1% | 1% | 16% | 0% | 2% | 0% | 1% | – | 3% | 11% | 3% | 0% | 56% | 5%[bm] |
| The New York Times/Siena College | July 23–27, 2023 | 932 (LV) | 0% | 2% | 17% | 0% | 3% | 0% | 0% | 0% | 3% | 2% | 3% | 0% | 54% | 14%[bn] |
| Big Village | July 24–26, 2023 | 718 (A) | 0.5% | 0.9% | 13.5% | 0.4% | 3.2% | – | 0.7% | 0.7% | 7.5% | 7.2% | 2.6% | – | 61.0% | 1.8%[bo] |
| Premise | July 21–26, 2023 | 442 (A) | – | 1% | 16% | – | 2% | – | – | – | 7% | 4% | 3% | – | 59% | 9%[bp] |
| Economist/YouGov | July 22–25, 2023 | 537 | 0% | 1% | 18% | 0% | 3% | 0% | 0% | – | 3% | 5% | 3% | 0% | 55% | 13%[bq] |
| McLaughlin & Associates | July 19–24, 2023 | 452 (LV) | 0% | 2% | 13% | 0% | 3% | 1% | 0% | 1% | 5% | 8% | 3% | 0% | 52% | 12%[br] |
| Morning Consult | July 21–23, 2023 | 3,576 | 1% | 2% | 16% | – | 4% | 0% | 0% | – | 6% | 8% | 2% | 0% | 59% | 1%[bs] |
| JMC Analytics | July 18–22, 2023 | 1,100 (LV) | 1.0% | 4.4% | 17.0% | – | 3.1% | – | 1.0% | 0.0% | 3.2% | 2.9% | 4.5% | – | 53.0% | 10%[bt] |
| Harvard-Harris | July 19–20, 2023 | 729 (RV) | 1% | 2% | 12% | 0% | 4% | 0% | 1% | 0% | 7% | 10% | 2% | 0% | 52% | 10%[bu] |
| Rasmussen Reports | July 18–20, 2023 | 1,031 (LV) | – | 5% | 13% | – | 3% | – | 3% | – | 5% | 3% | 4% | – | 57% | 5% |
| Monmouth University | July 12–19, 2023 | 681 (RV) | 1% | 3% | 22% | 0% | 3% | 0% | 0% | 1% | 3% | 5% | 3% | 0% | 54% | 6%[bv] |
| Kaplan Strategies | July 17–18, 2023 | 800 (LV) | 0% | 5% | 12% | – | 3% | – | 1% | – | 4% | 12% | 5% | – | 48% | 10% |
| Yahoo News | July 13–17, 2023 | 468 | 1% | 1% | 23% | 0% | 3% | – | 0% | – | 3% | 3% | 4% | 0% | 48% | 13%[bw] |
| Quinnipiac University | July 13–17, 2023 | 727 (RV) | 0% | 3% | 25% | 0% | 4% | 0% | 0% | – | 4% | 2% | 3% | 0% | 54% | 3%[bx] |
| Reuters/Ipsos | July 11–17, 2023 | 4,414 | 0% | 3% | 19% | – | 3% | 0% | 0% | – | 7% | 9% | 2% | 0% | 47% | 11%[by] |
| Morning Consult | July 14–16, 2023 | 3,630 | 0% | 2% | 20% | – | 4% | 0% | 0% | – | 7% | 8% | 3% | 0% | 55% | 1%[bz] |
| Premise | July 7–14, 2023 | 355 (RV) | – | 2% | 19% | – | 3% | – | – | – | 5% | 4% | 2% | – | 58% | 9%[ca] |
| YouGov/The Economist | July 8–11, 2023 | 502 (RV) | 0% | 2% | 22% | 0% | 3% | 0% | 0% | – | 5% | 2% | 3% | 0% | 48% | 13%[cb] |
| Morning Consult | July 7–9, 2023 | 3,616 | 0% | 3% | 17% | – | 3% | 0% | 1% | – | 7% | 8% | 3% | 0% | 56% | 1%[cc] |
| I&I/TIPP | July 5–7, 2023 | 486 (RV) | 1% | 2% | 14% | 1% | 3% | – | 1% | – | 6% | 7% | 3% | – | 53% | 9%[cd] |
| Echelon Insights | June 26–29, 2023 | 413 (LV) | 1% | 2% | 16% | 0% | 5% | 0% | 0% | – | 5% | 10% | 4% | 1% | 49% | 6%[ce] |
| Fox News | June 23–26, 2023 | 391 | 0% | 1% | 22% | 1% | 3% | 0% | 1% | – | 4% | 5% | 4% | 0% | 56% | 4%[cf] |
| Morning Consult | June 23–25, 2023 | 3,650 | 0% | 2% | 19% | – | 3% | 0% | 1% | – | 7% | 6% | 3% | 0% | 57% | 1%[cg] |
| Will Hurd declares his candidacy. | ||||||||||||||||
| Emerson College | June 19–20, 2023 | 365 (RV) | 1% | 2% | 21% | – | 4% | – | 1% | – | 6% | 2% | 2% | – | 59% | 2%[ch] |
| NBC News | June 16–20, 2023 | 500 (RV) | 0% | 5% | 22% | – | 4% | – | 2% | – | 7% | 3% | 3% | – | 51% | 0%[ci] |
| YouGov | June 16–20, 2023 | 366 (RV) | 0% | 4% | 25% | 1% | 2% | – | 0% | – | 5% | 2% | 4% | 0% | 47% | 10%[cj] |
| Morning Consult | June 17–19, 2023 | 3,521 (PV) | 0% | 3% | 20% | – | 3% | – | 1% | – | 7% | 3% | 3% | – | 57% | 1%[ck] |
| McLaughlin & Associates | June 15–19, 2023 | 454 | 1% | 2% | 19% | 0% | 4% | – | 0% | 0% | 5% | 2% | 5% | 1% | 52% | 8%[cl] |
| CNN/SSRS | June 13–17 2023 | 1,350 (A) | 0% | 3% | 26% | 0% | 5% | – | 1% | – | 9% | 1% | 4% | – | 47% | 2%[cm] |
| Harvard-Harris | June 14–15, 2023 | 2,090 (RV) | 0% | 2% | 14% | – | 4% | – | 0% | – | 8% | 3% | 2% | – | 59% | 7%[cn] |
| The Messenger/HarrisX | June 14–15, 2023 | 283 (RV) | 0% | 2% | 17% | – | 3% | – | 1% | – | 6% | 2% | 4% | – | 53% | 11%[co] |
| Francis Suarez declares his candidacy. | ||||||||||||||||
| Big Village | June 9–14, 2023 | 724 (RV) | 1.0% | 1.4% | 15.3% | 1.1% | 4.5% | – | 0.8% | 0.5% | 9.9% | 3.2% | 3.6% | – | 56.4% | 2.5%[cp] |
| Economist/YouGov | June 10–13, 2023 | 411 (RV) | – | 2% | 21% | – | 4% | – | – | – | 4% | 1% | 3% | – | 51% | 14%[cq] |
| Quinnipiac University | June 8–12, 2023 | 700 (RV) | 0% | 4% | 23% | 0% | 4% | – | 1% | – | 4% | 3% | 4% | – | 53% | – |
| Morning Consult | June 9–11, 2023 | 3,419 | 0% | 2% | 19% | – | 3% | – | 1% | – | 8% | 3% | 4% | – | 59% | 1%[cr] |
| Donald Trump is indicted by a federal grand jury for his alleged mishandling of classified documents after his presidency. | ||||||||||||||||
| CBS News | June 7–10, 2023 | 2,480 (A) | 1% | 1% | 23% | 1% | 3% | – | 1% | – | 4% | 1% | 4% | – | 61% | – |
| Doug Burgum declares his candidacy. | ||||||||||||||||
| Chris Christie declares his candidacy. | ||||||||||||||||
| Mike Pence declares his candidacy. | ||||||||||||||||
| USA Today/Suffolk | June 5–9, 2023 | – | 0% | 2% | 23% | 1% | 4% | – | 1% | – | 4% | – | 6% | – | 48% | – |
| Reuters/Ipsos | June 5–9, 2023 | 1,005 (A) | 1% | 2% | 22% | 0% | 3% | – | 0% | – | 7% | 3% | 2% | – | 43% | 17%[cs] |
| Morning Consult | June 2–4, 2023 | 3,545 (LV) | – | 1% | 22% | – | 3% | – | 1% | – | 7% | 3% | 3% | – | 56% | 5%[ct] |
| I&I/TIPP | May 31 – June 2, 2023 | 1,230 (RV) | – | 1% | 19% | 0% | 3% | – | 1% | – | 6% | 2% | 3% | – | 55% | 10%[cu] |
| Premise | May 29 – June 1, 2023 | 563 (RV) | – | 1% | 20% | – | 3% | – | – | – | 4% | 1% | 2% | – | 57% | 11%[cv] |
| YouGov | May 25–30, 2023 | 432 (RV) | – | – | 25% | 1% | 3% | – | 1% | – | – | 3% | 3% | – | 53% | 11% |
| Big Village | May 26–28, 2023 | 389 | – | – | 24% | – | 5% | – | 1% | – | – | 3% | 5% | – | 58% | 5%[cw] |
| Morning Consult | May 26–28, 2023 | 3,485 (LV) | – | – | 22% | – | 4% | – | 1% | – | 5% | 4% | 3% | – | 56% | 5%[cx] |
| Ron DeSantis declares his candidacy. | ||||||||||||||||
| McLaughlin & Associates | May 17–24, 2023 | 446 (LV) | 0% | 1% | 16% | 0% | 3% | 0% | 1% | – | 7% | 4% | 2% | – | 54% | 13%[cy] |
| FOX News | May 19–22, 2023 | 412 (RV) | – | 0% | 20% | 0% | 4% | – | 0% | – | 5% | 4% | 2% | 0% | 53% | 12%[cz] |
| Quinnipiac | May 18–22, 2023 | 1,616 (RV) | – | 2% | 25% | 1% | 3% | – | 0% | 0% | 2% | 1% | 2% | – | 56% | 8%[da] |
| Morning Consult | May 19–21, 2023 | 3,526 (LV) | – | – | 20% | – | 4% | – | 0% | – | 6% | 4% | 2% | – | 58% | 6%[db] |
| CNN | May 17–20, 2023 | 467 (RV) | 1% | 2% | 26% | 0% | 6% | – | 1% | – | 6% | 1% | 1% | – | 53% | 2%[dc] |
| Tim Scott declares his candidacy. | ||||||||||||||||
| Harvard-Harris | May 17–18, 2023 | 2,004 (RV) | – | – | 16% | – | 4% | – | 1% | – | 4% | 4% | 1% | – | 58% | 12%[dd] |
| Cygnal | May 16–18, 2023 | 2,527 (LV) | – | – | 20.9% | – | 4.7% | – | 1.0% | – | 4.3% | 4.8% | 1.5% | – | 51.5% | 11.3%[de] |
| Marquette University | May 8–18, 2023 | 1,000 (A) | – | 0% | 25% | 1% | 5% | – | 0% | – | 2% | 3% | 1% | 46% | 17%[df] | |
| Rasmussen Reports | May 11–15, 2023 | 996 (LV) | – | – | 17% | – | 5% | – | 3% | – | 6% | 2% | – | – | 62% | 5%[dg] |
| Reuters/Ipsos | May 9–15, 2023 | 4,410 (A) | – | – | 21% | – | 4% | – | 1% | – | 5% | 4% | 1% | – | 49% | 15%[dh] |
| Morning Consult | May 12–14, 2023 | 3,571 (LV) | – | – | 18% | – | 4% | – | 1% | – | 6% | 4% | 1% | – | 61% | 5%[di] |
| Morning Consult | May 5–7, 2023 | 3,574 (RV) | – | – | 19% | – | 3% | – | 1% | – | 5% | 5% | 1% | – | 60% | 4%[dj] |
| I&I/TIPP | May 3–5, 2023 | 469 (RV) | – | – | 17% | 1% | 4% | – | 1% | – | 6% | 4% | 2% | – | 55% | 10%[dk] |
| ABC News/Washington Post | April 28 – May 3, 2023 | 438 (LV) | – | – | 25% | – | 6% | – | 1% | – | 6% | – | 4% | – | 53% | 5%[dl] |
| Premise | April 27 – May 1, 2023 | 752 (RV) | – | 1% | 21% | – | 4% | – | – | – | 5% | 2% | 1% | – | 58% | 8%[dm] |
| Morning Consult | April 28–30, 2023 | 3,389 (LV) | – | – | 22% | – | 4% | – | – | – | 7% | 3% | 2% | – | 56% | 5%[dn] |
| CBS News | April 27–29, 2023 | 2,372 (A) | – | 2% | 22% | 2% | 4% | – | 1% | – | 5% | 5% | 1% | – | 58% | – |
| Emerson College | April 24–25, 2023 | 446 (LV) | – | 2% | 16% | – | 3% | – | 2% | – | 7% | 3% | – | – | 62% | 4%[do] |
| Ryan Binkley declares his candidacy. | ||||||||||||||||
| FOX News | April 21–24, 2023 | 408 (RV) | – | – | 21% | 1% | 4% | – | – | – | 6% | 3% | 2% | – | 53% | 2%[dp] |
| Reuters/Ipsos | April 21–24, 2023 | 361 (RV) | – | – | 23% | 1% | 3% | – | – | – | 6% | 2% | – | – | 49% | 17%[dq] |
| Morning Consult | April 21–23, 2023 | 3,640 (LV) | – | – | 21% | – | 3% | – | 1% | – | 7% | 3% | 1% | – | 58% | 6%[dr] |
| Larry Elder declares his candidacy. | ||||||||||||||||
| Cygnal | April 18–20, 2023 | 2,500 (LV) | – | – | 25.5% | – | 4.6% | – | 1.3% | – | 4.5% | 2% | 1.5% | – | 46.1% | 14.5%[ds] |
| Harvard-Harris | April 18–19, 2023 | 1,845 (RV) | – | – | 20% | – | 4% | – | 0% | – | 7% | 2% | 1% | – | 55% | 4%[dt] |
| NBC News | April 14–18, 2023 | 1,000 (RV) | – | – | 31% | – | 3% | – | 3% | – | 6% | 2% | 3% | – | 46% | 2%[du] |
| Wall Street Journal | April 11–17, 2023 | 600 (LV) | – | – | 24% | – | 5% | – | – | – | 1% | 2% | 3% | – | 48% | 17%[dv] |
| Morning Consult | April 14–16, 2023 | 3,499 (LV) | – | – | 24% | – | 4% | – | – | – | 7% | 3% | 2% | – | 53% | 5%[dw] |
| Tim Scott forms his exploratory committee | ||||||||||||||||
| Morning Consult | April 7–9, 2023 | 3,608 (LV) | – | – | 23% | – | 4% | – | 1% | – | 7% | 1% | 1% | – | 56% | 7%[dx] |
| Reuters/Ipsos | April 5–6, 2023 | 1,004 (A) | – | 0% | 21% | – | 1% | – | 1% | – | 4% | 1% | – | – | 58% | 5%[dy] |
| Reuters | March 22 – April 3, 2023 | 2,005 (LV) | – | 2% | 19% | – | 6% | – | – | – | 5% | – | – | – | 48% | 5%[dz] |
| Asa Hutchinson declares his candidacy. | ||||||||||||||||
| Morning Consult | March 31 – April 2, 2023 | 3,488 (RV) | – | – | 26% | – | 4% | – | – | – | 7% | – | 1% | – | 55% | 7% [ea] |
| Trafalgar | March 31 – April 2, 2023 | 1,123 (RV) | – | – | 22.5% | 0.4% | 3.7% | – | – | – | 3.8% | 0.5% | 1% | – | 56.2% | 12%[eb] |
| InsiderAdvantage | March 31 – April 1, 2023 | 550 (LV) | – | 2% | 24% | – | 5% | – | – | – | 4% | 1% | 0% | – | 57% | 3%[ec] |
| YouGov | March 30–31, 2023 | 1,089 (A) | – | 2% | 21% | – | 5% | – | – | – | 3% | 1% | – | – | 52% | 2%[ed] |
| Donald Trump is indicted by a Manhattan grand jury for his alleged role in a scandal relating to hush money payments made to pornographic film actress Stormy Daniels. | ||||||||||||||||
| Echelon Insights | March 27–29, 2023 | 370 (RV) | – | 0% | 26% | – | 4% | 0% | – | – | 8% | 1% | 1% | – | 49% | 2%[ee] |
| Morning Consult | March 24–28, 2023 | 3,452 (RV) | – | – | 26% | – | 5% | – | – | – | 7% | 1% | 2% | – | 52% | 7%[ef] |
| Cygnal | March 26–27, 2023 | 2,550 (RV) | – | – | 28.7% | – | 4.1% | – | – | 0.4% | 5.7% | 1.1% | 1% | – | 42.2% | 16.7%[eg] |
| FOX News | March 24–27, 2023 | 426 (RV) | – | 1% | 24% | – | 3% | – | 1% | – | 6% | 1% | 0% | 0% | 54% | 9%[eh] |
| Beacon Research/Fox News | March 24–27, 2023 | – | – | 1% | 24% | – | 3% | – | 1% | – | 6% | 1% | – | – | 54% | 8%[ei] |
| Quinnipiac University | March 23–27, 2023 | 671 (RV) | – | 1% | 33% | – | 4% | – | – | 0% | 5% | – | 1% | – | 47% | 7%[ej] |
| Harris Poll | March 22–23, 2023 | – | – | – | 24% | – | 5% | – | – | – | 7% | 0% | 2% | – | 50% | 6%[ek] |
| Monmouth University | March 16–20, 2023 | 521 (RV) | – | – | 27% | – | 3% | – | – | – | 1% | – | 1% | – | 41% | 6%[el] |
| Morning Consult | March 17–19, 2023 | 3,394 (RV) | – | – | 26% | – | 4% | – | – | – | 7% | 1% | 1% | – | 54% | 7%[em] |
| Big Village | March 15–17, 2023 | 361 (A) | – | – | 23.3% | – | 3.6% | – | – | – | 10.2% | 0.5% | – | – | 51.9% | 10.4%[en] |
| Quinnipiac | March 9–13, 2023 | 677 (RV) | – | 1% | 32% | – | 5% | – | 0% | 0% | 3% | 0% | 1% | – | 46% | 12%[eo] |
| CNN | March 8–12, 2023 | 963 (LV) | – | – | 36% | – | 6% | – | 1% | – | 6% | – | 2% | – | 40% | 8%[ep] |
| Premise | March 4–7, 2023 | 639 (RV) | – | – | 23% | – | 6% | – | – | – | 5% | – | 1% | – | 55% | 11%[eq] |
| Morning Consult | March 3–5, 2023 | 3,071 (RV) | – | – | 28% | – | 4% | – | – | – | 7% | 0% | 1% | – | 53% | 5%[er] |
| Perry Johnson declares his candidacy. | ||||||||||||||||
| Yahoo News | February 23–27, 2023 | 444 (RV) | – | 0% | 29% | – | 4% | – | – | – | 2% | – | – | – | 45% | 19%[es] |
| Susquehanna | February 19–26, 2023 | 300 (RV) | – | – | 37% | – | 4% | – | – | – | 2% | – | 1% | – | 32% | 20%[et] |
| Emerson College | February 24–25, 2023 | 536 (RV) | – | – | 25% | – | 5% | – | – | – | 8% | – | – | – | 55% | 7%[eu] |
| Morning Consult | February 23–25, 2023 | 3,320 (RV) | – | – | 30% | – | 6% | – | – | – | 7% | 1% | 1% | – | 48% | 7%[ev] |
| Echelon Insights | February 21–23, 2023 | 419 (LV) | – | – | 31% | – | 6% | – | – | – | 9% | – | – | – | 41% | – |
| Vivek Ramaswamy declares his candidacy. | ||||||||||||||||
| McLaughlin & Associates | February 17–23, 2023 | 441 (LV) | – | – | 26% | – | 6% | – | – | – | 5% | 1% | 1% | – | 42% | 21%[ew] |
| Fox News | February 19–22, 2023 | 413 | – | 0% | 28% | – | 7% | – | 0% | – | 7% | – | 1% | 0% | 43% | 14%[ex] |
| Rasmussen Reports | February 16–20, 2023 | – | – | – | 24% | – | 15% | – | – | – | – | – | – | – | 52% | – |
| Morning Consult | February 17–19, 2023 | 3,217 (RV) | – | – | 30% | – | 6% | – | – | – | 6% | – | – | – | 50% | 1%[ey] |
| Big Village | February 15–17, 2023 | 346 (A) | – | – | 23.6% | – | 6.8% | – | – | – | 8.7% | 0% | – | – | 50.2% | 10.8%[ez] |
| Harris Poll | February 15–16, 2023 | – | – | – | 23% | – | 6% | – | – | – | 7% | – | 1% | – | 46% | 7%[fa] |
| Morning Consult | February 14–16, 2023 | 2,476 (RV) | – | – | 29% | – | 5% | – | – | – | 7% | – | – | – | 50% | 1%[fb] |
| WPA Intelligence | February 13–16, 2023 | 1,000 (LV) | – | – | 40% | – | 8% | – | – | – | 8% | – | – | – | 31% | – |
| Nikki Haley declares her candidacy. | ||||||||||||||||
| Quinnipiac University | February 9–14, 2023 | 592 (RV) | – | – | 37% | – | 4% | – | – | – | 4% | – | – | – | 50% | 5%[fc] |
| 592 (RV) | – | 0% | 31% | – | 4% | – | 0% | – | 3% | – | 1% | – | 48% | 10%[fd] | ||
| Morning Consult | February 11–13, 2023 | 2,476 (RV) | – | – | 31% | – | 4% | – | – | – | 8% | – | – | – | 47% | 1%[fe] |
| Ipsos | February 6–13, 2023 | 1,465 (RV) | – | 1.1% | 30.6% | – | 3.9% | – | – | – | 7.5% | – | – | – | 42.6% | 6.6%[ff] |
| Morning Consult | February 8–10, 2023 | 2,476 (RV) | – | – | 29% | – | 4% | – | – | – | 6% | – | – | – | 48% | 2%[fg] |
| Morning Consult | February 5–7, 2023 | 2,476 (RV) | – | – | 31% | – | 4% | – | – | – | 6% | – | – | – | 48% | 2%[fh] |
| OnMessage | January 30 – February 5, 2023 | 566 (RV) | – | – | 34% | – | 6% | – | – | – | 6% | – | 1% | – | 34% | 20%[fi] |
| YouGov | February 2–4, 2023 | 453 (RV) | – | – | 35% | – | 2% | – | – | – | 5% | – | – | – | 37% | – |
| Morning Consult | February 2–4, 2023 | 2,476 (RV) | – | – | 32% | – | 3% | – | – | – | 7% | – | – | – | 48% | 2%[fj] |
| Monmouth University | January 26 – February 2, 2023 | 566 (RV) | – | – | 33% | – | 1% | – | – | – | 2% | – | – | – | 33% | 7%[fk] |
| Morning Consult | January 30 – February 1, 2023 | 2,476 (RV) | – | – | 30% | – | 2% | – | – | – | 7% | – | – | – | 51% | 2%[fl] |
| Morning Consult | January 27–29, 2023 | 3,592 (RV) | – | – | 31% | – | 3% | – | – | – | 7% | – | – | – | 48% | 2%[fm] |
| Morning Consult | January 24–26, 2023 | 2,476 (RV) | – | – | 30% | – | 3% | – | – | – | 7% | – | – | – | 50% | 2%[fn] |
| Echelon Insights | January 23–25, 2023 | 467 (LV) | – | 0% | 34% | – | 2% | 0% | – | – | 8% | – | – | 0% | 36% | 8%[fo] |
| McLaughlin & Associates | January 19–24, 2023 | 457 (LV) | – | – | 31% | – | 3% | – | – | – | 5% | – | 1% | – | 43% | 18%[fp] |
| Morning Consult | January 21–23, 2023 | 2,476 (RV) | – | – | 31% | – | 3% | – | – | – | 7% | – | – | – | 49% | 2%[fq] |
| WPA Intelligence | January 17–23, 2023 | 3,015 (LV) | – | – | 33% | – | 5% | – | – | – | 7% | – | – | – | 37% | – |
| Emerson College | January 19–21, 2023 | 428 (RV) | – | – | 24.8% | – | 2.5% | – | – | – | 7.5% | – | – | – | 55.1% | 10.2%[fr] |
| North Star Opinion Research | January 16–21, 2023 | 1,000 (LV) | – | – | 39% | – | 4% | – | – | – | 9% | – | 1% | – | 28% | 21%[fs] |
| Big Village | January 18–20, 2023 | 355 (A) | – | – | 27.5% | – | 2.9% | – | – | – | 6.8% | – | – | – | 52.5% | 10.3%[ft] |
| Harris Poll | January 18–19, 2023 | – | – | – | 28% | – | 3% | – | – | – | 7% | – | – | – | 48% | 0%[fu] |
| Schoen Cooperman Research | January 14–18, 2023 | – | – | – | 31% | – | 3% | – | – | – | 8% | – | – | – | 42% | 2%[fv] |
| Morning Consult | January 15–17, 2023 | 2,476 (RV) | – | – | 32% | – | 3% | – | – | – | 8% | – | – | – | 47% | 2%[fw] |
| Morning Consult | January 15–17, 2023 | 2,476 (RV) | – | – | 30% | – | 3% | – | – | – | 8% | – | – | – | 48% | 2%[fx] |
| YouGov | January 14–17, 2023 | 472 (RV) | – | – | 32% | – | 4% | – | – | – | 5% | – | – | – | 44% | – |
| 500 (A) | – | – | 29% | – | 5% | – | – | – | 6% | – | – | – | 44% | 3%[fy] | ||
| YouGov | January 12–16, 2023 | 450 (LV) | – | 1% | 36% | – | 1% | – | – | – | 5% | – | – | – | 37% | – |
| Morning Consult | January 12–14, 2023 | 2,476 (RV) | – | – | 30% | – | 2% | – | – | – | 8% | – | – | – | 50% | 1%[fz] |
| Public Policy Polling | January 10–11, 2023 | 446 (LV) | – | – | 36% | – | 6% | – | – | – | 6% | – | – | – | 42% | – |
| Morning Consult | January 9–11, 2023 | 2,476 (RV) | – | – | 32% | – | 3% | – | – | – | 8% | – | – | – | 47% | 1%[ga] |
| YouGov | January 5–9, 2023 | 346 (RV) | – | – | 34% | – | 3% | – | 1% | – | 7% | – | 2% | – | 37% | 14%[gb] |
| Morning Consult | January 6–8, 2023 | 4,470 (RV) | – | – | 33% | – | 2% | – | – | – | 9% | – | – | – | 46% | 1%[gc] |
| Big Village | January 4–6, 2023 | 343 (A) | – | – | 35% | – | 2% | – | – | – | 8% | – | – | – | 48% | – |
| Morning Consult | January 3–5, 2023 | 2,476 (RV) | – | – | 32% | – | 2% | – | – | – | 8% | – | – | – | 48% | 1%[gd] |
| Morning Consult | December 31, 2022 – January 2, 2023 | 4,829 (RV) | – | – | 34% | – | 3% | – | – | – | 8% | – | – | – | 45% | 2%[ge] |
| Polls taken between June and December 2022 | ||||||||||||||||
|---|---|---|---|---|---|---|---|---|---|---|---|---|---|---|---|---|
| Poll source | Date(s) administered |
Sample size |
Greg Abbott |
Liz Cheney |
Ted Cruz |
Ron DeSantis |
Nikki Haley |
Larry Hogan |
Mike Pence |
Mike Pompeo |
Marco Rubio |
Tim Scott |
Chris Sununu |
Donald Trump |
Glenn Youngkin |
Other |
| Morning Consult | December 28–30, 2022 | 2,476 (RV) | 1% | 3% | 3% | 33% | 2% | – | 8% | 1% | – | 1% | – | 47% | 0% | 2%[gf] |
| Morning Consult | December 25–27, 2022 | 2,476 (RV) | 1% | 3% | 3% | 33% | 2% | – | 8% | 1% | – | 1% | – | 47% | 0% | 2%[gg] |
| Morning Consult | December 22–24, 2022 | 2,476 (RV) | 1% | 3% | 2% | 31% | 3% | – | 8% | 1% | – | 1% | – | 48% | 1% | 2%[gh] |
| Morning Consult | December 19–21, 2022 | 2,476 (RV) | 1% | 3% | 2% | 34% | 2% | – | 8% | 1% | – | 1% | – | 46% | 1% | 2%[gi] |
| YouGov | December 15–19, 2022 | 449 (RV) | – | 3% | – | 37% | 5% | 1% | 4% | 1% | – | – | – | 39% | 1% | 2%[gj] |
| Morning Consult | December 16–18, 2022 | 4,105 (RV) | 1% | 2% | 3% | 33% | 2% | – | 8% | 1% | – | 1% | – | 48% | 0% | 2%[gk] |
| Big Village | December 16–18, 2022 | 357 (A) | – | 3% | 4% | 27% | 4% | – | 10% | – | – | – | 1% | 51% | 1% | – |
| Harris Poll | December 14–15, 2022 | 666 (RV) | – | – | 2% | 25% | 4% | – | 6% | 2% | 1% | 1% | – | 48% | 0% | – |
| Morning Consult | December 13–15, 2022 | 2,476 (RV) | 1% | 2% | 3% | 32% | 2% | – | 7% | 1% | – | 1% | – | 48% | 0% | 2%[gl] |
| Echelon Insights | December 12–14, 2022 | 418 (RV) | 0% | 0% | 2% | 35% | 3% | 0% | 4% | 1% | 1% | 0% | 0% | 40% | 0% | 7%[gm] |
| 454 (LV) | 0% | 1% | 2% | 32% | 4% | 0% | 4% | 0% | 1% | 1% | 0% | 41% | 0% | 6%[gn] | ||
| Cygnal | December 12–14, 2022 | 1,019 (LV) | 1% | 3% | 2% | 35% | 4% | 1% | 7% | 0% | 1% | 1% | 0% | 40% | 0% | 7%[go] |
| Morning Consult | December 10–14, 2022 | 825 (RV) | 1% | 2% | 3% | 34% | 2% | – | 6% | 1% | – | 2% | – | 40% | 0% | 2%[gp] |
| McLaughlin & Associates | December 9–14, 2022 | 480 (LV) | 1% | 4% | – | 23% | 3% | 1% | 5% | 1% | 1% | 1% | – | 48% | 1% | 5%[gq] |
| Morning Consult | December 10–12, 2022 | 2,476 (RV) | 1% | 2% | 3% | 31% | 3% | – | 8% | 1% | – | 1% | – | 50% | 0% | 2%[gr] |
| Monmouth University | December 8–12, 2022 | 563 (RV) | – | – | 1% | 39% | 1% | – | 2% | – | – | – | – | 26% | – | – |
| Morning Consult | December 7–9, 2022 | 2,476 (RV) | 1% | 2% | 2% | 30% | 3% | – | 9% | 1% | – | 1% | – | 48% | 0% | 2%[gs] |
| Morning Consult | December 4–6, 2022 | 2,476 (RV) | 1% | 3% | 3% | 30% | 2% | – | 8% | 0% | – | 1% | – | 50% | 0% | 2%[gt] |
| YouGov | December 1–5, 2022 | 435 (RV) | – | 3% | – | 33% | 6% | 1% | 4% | 2% | – | – | – | 35% | 2% | 2%[gu] |
| 521 (A) | – | 2% | – | 30% | 5% | 1% | 5% | 2% | – | – | – | 35% | 2% | 2%[gv] | ||
| Morning Consult | December 1–3, 2022 | 2,476 (RV) | 1% | 3% | 2% | 30% | 3% | – | 8% | 1% | – | 1% | – | 49% | 0% | 2%[gw] |
| Big Village | November 30 – December 2, 2022 | 368 (A) | – | 2% | 2% | 27% | 3% | – | 7% | – | – | – | 1% | 56% | 0% | – |
| YouGov | November 26–29, 2022 | 385 (A) | – | – | 3% | 30% | 3% | – | 8% | – | 3% | – | – | 36% | – | 9%[gx] |
| Cornell University Collaborative Midterm Survey | October 26 – November 25, 2022 | 3,110 (A) | – | 10% | – | 28% | 4% | – | 11% | 4% | – | – | – | 40% | – | 4%[gy] |
| Ipsos | November 18–20, 2022 | 849 (RV) | 1% | 2% | 2% | 37% | 3% | 2% | 6% | 0% | 0% | 0% | 0% | 25% | 1% | 2%[gz] |
| Morning Consult | November 18–20, 2022 | 849 (RV) | – | 2% | 3% | 30% | 2% | 0% | 7% | 1% | 1% | 0% | – | 45% | – | 5%[ha] |
| Emerson College | November 18–19, 2022 | 614 (RV) | – | 4% | 3% | 25% | 3% | 1% | 8% | – | – | – | – | 42% | – | 2%[hb] |
| Echelon Insights | November 17–19, 2022 | 424 (RV) | 0% | 1% | 3% | 31% | 1% | 1% | 11% | 1% | 1% | 0% | 0% | 42% | 0% | 6%[hc] |
| 424 (LV) | 0% | 1% | 3% | 37% | 1% | 1% | 9% | 1% | 1% | 0% | 0% | 38% | 0% | 5%[hd] | ||
| Harris Poll | November 16–17, 2022 | – | – | – | 3% | 28% | 2% | – | 7% | 1% | 1% | 1% | – | 46% | 1% | – |
| Donald Trump declares his candidacy. | ||||||||||||||||
| Morning Consult | November 10–14, 2022 | 842 (RV) | – | 1% | 2% | 33% | 1% | 1% | 5% | 0% | 1% | 0% | – | 47% | 1% | 6%[he] |
| Zogby Analytics | November 9–11, 2022 | 864 (LV) | – | – | – | 28% | 3% | – | 8% | – | – | 1% | – | 47% | 1% | 4%[hf] |
| Big Village | November 9–10, 2022 | 384 (A) | – | 3% | – | 34% | – | – | 10% | – | – | – | – | 50% | – | – |
| 2022 midterm elections | ||||||||||||||||
| Morning Consult | November 2–7, 2022 | 1,691 (RV) | – | – | 2% | 26% | 2% | 0% | 7% | – | 1% | 1% | – | 48% | – | 5%[hg] |
| Big Village | November 2–4, 2022 | 290 (LV) | – | 3% | – | 30% | – | – | 12% | – | – | – | – | 48% | – | – |
| 373 (A) | – | 3% | – | 27% | – | – | 12% | – | – | – | – | 56% | – | – | ||
| Big Village | October 31 – November 2, 2022 | 272 (LV) | – | 2% | – | 28% | – | – | 13% | – | – | – | – | 53% | – | – |
| 354 (A) | – | 3% | – | 26% | – | – | 12% | – | – | – | – | 56% | – | – | ||
| Morning Consult | October 28–31, 2022 | 838 (RV) | – | 2% | 2% | 24% | 3% | 0% | 9% | 1% | 1% | 0% | – | 49% | – | 5%[hh] |
| YouGov | October 11–26, 2022 | 1,720 (RV) | 3% | 2% | – | 33% | 14% | – | – | – | – | – | 1% | 55% | 1% | – |
| YouGov | October 17–19, 2022 | – | – | – | 3% | 29% | 4% | – | 6% | 0% | – | 0% | – | 53% | – | – |
| McLaughlin & Associates | October 12–17, 2022 | 454 (LV) | 1% | 1% | – | 23% | – | 0% | 7% | – | 1% | 0% | – | 53% | – | 4%[hi] |
| Harris Poll | October 12–13, 2022 | 724 (RV) | – | – | 3% | 17% | 2% | – | 7% | 2% | 3% | 1% | 0% | 55% | – | – |
| Cygnal | October 10–12, 2022 | 1,204 (LV) | 1% | 3% | 2% | 26% | 3% | 1% | 9% | 1% | 1% | 0% | 0% | 45% | 0% | 4%[hj] |
| Siena College/The New York Times Upshot | October 9–12, 2022 | 332 (LV) | – | – | 3% | 28% | 4% | – | 7% | 2% | – | – | – | 47% | – | – |
| 332 (RV) | – | – | 4% | 26% | 3% | – | 6% | 2% | – | – | – | 49% | – | 6%[hk] | ||
| Big Village | October 5–7, 2022 | 287 (RV) | – | 3% | – | 28% | – | – | 11% | – | – | – | – | 55% | – | – |
| 372 (A) | – | 3% | – | 23% | – | – | 10% | – | – | – | – | 58% | – | – | ||
| Big Village | September 17–22, 2022 | 323 (RV) | – | 2% | – | 24% | – | – | 12% | – | – | – | – | 59% | – | – |
| 378 (A) | – | 2% | – | 24% | – | – | 12% | – | – | – | – | 61% | – | – | ||
| McLaughlin & Associates | September 17–22, 2022 | 465 (LV) | 2% | 2% | 0% | 18% | 0% | 1% | 6% | 0% | 2% | 1% | – | 55% | – | 6%[hl] |
| Morning Consult | September 16–18, 2022 | 831 (RV) | – | 3% | 2% | 19% | 2% | 0% | 8% | 1% | 1% | 1% | – | 52% | – | 5%[hm] |
| TIPP Insights | September 7–9, 2022 | 534 (RV) | 1% | 1% | 2% | 15% | 2% | – | 8% | 1% | 2% | 1% | – | 54% | – | 5%[hn] |
| Big Village | September 7–9, 2022 | 337 (A) | – | 2% | – | 20% | – | – | 13% | – | – | – | – | 61% | – | – |
| Harris Poll | September 7–8, 2022 | 667 (RV) | – | – | 1% | 17% | 2% | – | 9% | 1% | 1% | 1% | – | 59% | – | – |
| Big Village | August 20–24, 2022 | 329 (A) | – | 2% | – | 22% | – | – | 11% | – | – | – | – | 59% | – | – |
| McLaughlin & Associates | August 20–24, 2022 | 461 (LV) | 2% | 3% | 0% | 15% | 0% | 2% | 6% | 0% | 1% | 1% | – | 55% | – | 8%[ho] |
| Echelon Insights | August 19–22, 2022 | 422 (RV) | – | 4% | – | 22% | – | 2% | 12% | 1% | – | – | – | 46% | – | 2%[hp] |
| 459 (LV) | – | 5% | – | 25% | – | 1% | 13% | 1% | – | – | – | 46% | – | 1%[hq] | ||
| Morning Consult | August 19–21, 2022 | 846 (RV) | – | 3% | 2% | 18% | 3% | 1% | 8% | 0% | 1% | 1% | – | 57% | – | 4%[hr] |
| Big Village | August 10–12, 2022 | 342 (A) | – | 0% | – | 16% | – | – | 11% | – | – | – | – | 68% | – | – |
| Morning Consult | August 10, 2022 | 872 (RV) | – | 2% | 2% | 18% | 2% | 1% | 8% | 1% | 1% | 1% | – | 56% | – | 5%[hs] |
| TIPP Insights | August 2–4, 2022 | 575 (RV) | 1% | 1% | 3% | 17% | 1% | – | 10% | 1% | 1% | 0% | – | 53% | – | 6%[ht] |
| Harris Poll | July 27–28, 2022 | 679 (RV) | – | – | 3% | 19% | 5% | – | 7% | 1% | 1% | 1% | – | 52% | – | – |
| Suffolk University | July 22–25, 2022 | 414 (RV) | – | 3% | – | 34% | 3% | – | 7% | 1% | – | – | – | 43% | – | 1%[hu] |
| Morning Consult | July 15–17, 2022 | 840 (RV) | – | 2% | 3% | 23% | 2% | 0% | 7% | 1% | 1% | 1% | – | 53% | – | 5%[hv] |
| Morning Consult | July 8–10, 2022 | 840 (RV) | – | 2% | 2% | 21% | 3% | 1% | 8% | 1% | 1% | 0% | – | 52% | – | 5%[hw] |
| Siena College/The New York Times Upshot | July 5–7, 2022 | 350 (LV) | – | – | 7% | 25% | 5% | 0% | 6% | 2% | 2% | – | – | 49% | – | 5%[hx] |
| Harris Poll | June 29–30, 2022 | 474 (RV) | – | – | 1% | 16% | 4% | – | 7% | 1% | 2% | 2% | – | 56% | – | |
| – | – | – | 20% | 3% | – | 9% | 1% | – | – | – | 55% | – | – | |||
| Morning Consult | June 24–26, 2022 | 2,004 (RV) | – | 1% | 2% | 23% | 2% | 0% | 8% | 0% | 2% | 0% | – | 51% | – | 5%[hy] |
| McLaughlin & Associates | June 17–22, 2022 | 436 (LV) | 1% | 1% | – | 15% | – | 1% | 7% | – | 2% | 1% | – | 59% | – | 9%[hz] |
| TIPP Insights | June 8–10, 2022 | 385 (RV) | 1% | – | 2% | 12% | 4% | – | 7% | 0% | 2% | 2% | – | 55% | – | 5%[ia] |
| Polls taken between 2020 and June 2022 | |||||||||||||||
|---|---|---|---|---|---|---|---|---|---|---|---|---|---|---|---|
| Source of poll | Dates administered |
Sample size | Margin | Ted Cruz |
Ron DeSantis |
Nikki Haley |
Mike Pence |
Donald Trump |
Other | Undecided[ib] | |||||
| Harvard/Harris | January 19–20, 2022 | 1,815 (RV) | – | 4% | 12% | 2% | 11% | 57% | 13%[ic] | – | |||||
| McLaughlin & Associates | January 13–18, 2022 | 468 (LV) | – | – | 13% | 4% | 9% | 53% | – | 8% | |||||
| John Bolton Super PAC | January 6, 2022 | 501 (LV) | – | 5% | 19% | 4% | 4% | 36% | – | 22% | |||||
| UMass Amherst | December 14–20, 2021 | 306 (A) | – | 6% | 20% | 7% | 6% | 55% | – | – | |||||
| McLaughlin & Associates | November 11–16, 2021 | 450 (LV) | – | 2% | 15% | 3% | 7% | 55% | 6% | 8% | |||||
| Zogby Analytics | November 8–10, 2021 | 371 (LV) | – | 2% | 7% | 5% | 12% | 59% | 6%[id] | 4% | |||||
| YouGov/Yahoo News | November 4–8, 2021 | 559 (A) | – | – | 21% | 5% | 4% | 44% | 1%[ie] | 19% | |||||
| Harvard/Harris | October 26–28, 2021 | 490 (LV) | ±4.0% | – | 10% | – | 9% | 47% | 15% | 19% | |||||
| YouGov/Yahoo News | October 19–21, 2021 | 629 (A) | – | – | 18% | 4% | 5% | 41% | 2%[if] | 24% | |||||
| Echelon Insights (Archive) Archived October 20, 2021, at the Wayback Machine | October 15–19, 2021 | 476 (RV) | – | – | – | – | – | 66%[ig] | 31% | 4% | |||||
| McLaughlin & Associates | October 14–18, 2021 | 463 (LV) | – | 3% | 10% | 4% | 9% | 53%[ig] | 9%[ih] | 6% | |||||
| Morning Consult | October 8–11, 2021 | 803 (RV) | – | 3% | 12% | 3% | 12% | 47% | 6%[ii] | 4% | |||||
| Echelon Insights | September 17–23, 2021 | 479 (RV) | – | – | – | – | – | 59%[ig] | 32% | 9% | |||||
| John Bolton Super PAC | September 16–18, 2021 | 1,000 (LV) | ± 3.1% | 5% | 25% | 6% | 3% | 26% | 10%[ij] | 20% | |||||
| Harvard/Harris | September 15–16, 2021 | 490 (LV) | ±4.0% | – | 9% | 3% | 13% | 58% | 0% | 14% | |||||
| McLaughlin & Associates | September 9–14, 2021 | 456 (LV) | – | 3% | 8% | 2% | 10% | 59%[ig] | 7%[ik] | 4% | |||||
| Emerson College | August 30 – September 1, 2021 | 395 (RV) | ± 4.9% | 2% | 10% | 7% | 6% | 67% | 5%[il] | 1% | |||||
| McLaughlin & Associates | July 29 – August 3, 2021 | 467 (LV) | – | 3% | 11% | 4% | 8% | 54%[ig] | 7%[im] | 6% | |||||
| YouGov/Yahoo News | July 30 – August 2, 2021 | 518 (A) | – | – | 13% | 4% | 3% | 58% | 1%[in] | 17% | |||||
| Fabrizio, Lee & Associates | July 6–8, 2021 | 800 (RV) | ± 3.5% | 2% | 19% | 3% | 8% | 47%[ig] | 2%[io] | 13% | |||||
| John Bolton Super PAC | July 8, 2021 | 1,000 (LV) | – | 5% | 13% | 5% | 6% | 46% | 22% | – | |||||
| Echelon Insights | June 18–22, 2021 | 386 (RV) | – | – | – | – | – | 59%[ig] | 35% | 6% | |||||
| McLaughlin & Associates | June 16–20, 2021 | 444 (LV) | – | 4% | 9% | 3% | 8% | 55%[ig] | 8%[ip] | 7% | |||||
| YouGov/Yahoo News | May 24–26, 2021 | 378 (A) | – | – | – | – | – | 65% | 19%[iq] | 16% | |||||
| Quinnipiac | May 18–24, 2021 | ~290 (A)[ir] | – | – | – | – | – | 66% | 30%[is] | 4% | |||||
| McLaughlin & Associates | May 12–18, 2021 | 444 (LV) | – | 3% | 8% | 5% | 10% | 57%[ig] | 7%[it] | 7% | |||||
| Echelon Insights | May 14–17, 2021 | 479 (RV) | – | – | – | – | – | 63%[ig] | 31% | 6% | |||||
| Morning Consult/Politico | May 14–17, 2021 | 782 (RV) | ± 2% | 4% | 8% | 4% | 13% | 48% | 9%[iu] | – | |||||
| YouGov/Yahoo News | May 11–13, 2021 | 348 (A) | – | – | – | – | – | 68% | 22%[iv] | 10% | |||||
| Trafalgar Group | April 30 – May 6, 2021 | – (LV)[iw] | –[ig] | – | – | – | – | 62% | 27%[ix] | 11%[iy] | |||||
| Echelon Insights | April 16–23, 2021 | 440 (RV) | – | – | – | – | – | 59%[ig] | 35% | 6% | |||||
| McLaughlin & Associates | April 8–13, 2021 | 441 (LV) | 1% | 3% | 7% | 2% | 10% | 55%[ig] | 8%[iz] | 9% | |||||
| PEM Management Corporation | April 3–7, 2021 | 494 (LV) | – | 7% | 9% | 9% | 6% | 44% | 1%[ja] | – | |||||
| Echelon Insights | March 15–21, 2021 | 1,008 (RV) | – | – | – | – | – | 60%[ig] | 30% | 10% | |||||
| Fabrizio, Lee & Associates/The Hill | February 20 – March 2, 2021 | 1,264 (LV) | ± 2.7% | 3% | 7% | 6% | 9% | 51%[ig] | 3%[jb] | 12% | |||||
| – | – | – | – | 57%[jc] | 16%[jd] | 27% | |||||||||
| McLaughlin & Associates | February 24–28, 2021 | 448 (LV) | – | 5% | 4% | 3% | 8% | 54%[ig] | 9%[je] | 10% | |||||
| Harvard/Harris | February 23–25, 2021 | 546 (RV) | – | 5% | – | 7% | 18% | 52%[ig] | 13%[jf] | – | |||||
| Echelon Insights | February 12–18, 2021 | 430 (RV) | – | – | – | – | – | 55%[ig] | 32% | 14% | |||||
| Morning Consult/Politico | February 14–15, 2021 | 645 (RV) | ± 4% | 4% | – | 6% | 12% | 54% | 10%[jg] | – | |||||
| Echelon Insights | January 20–26, 2021 | – (RV)[jh] | – | – | – | – | – | 48% | 40% | 11% | |||||
| Inauguration of Joe Biden | |||||||||||||||
| Léger | January 15–17, 2021 | 1,007 (A)[ji] | ± 3.09% | 6% | 2% | 7% | 13% | 29%[ig] | 6%[jj] | – | |||||
| Ipsos/Axios | January 11–13, 2021 | 334 (A) | ± 5.8% | – | – | – | – | 57% | 41% | 1%[jk] | |||||
| Morning Consult/Politico | January 8–11, 2021 | 702 (RV) | – | 7% | – | 6% | 18% | 40% | 15%[jl] | – | |||||
| January 6 United States Capitol attack | |||||||||||||||
| McLaughlin & Associates | December 9–13, 2020 | 442 (LV) | – | 5% | 1% | 3% | 11% | 56% | 5%[jm] | 10% | |||||
| Fox News | December 6–9, 2020 | ~ 413 (RV) | ± 4.5% | – | – | – | – | 71% | 21%[jn] | 8% | |||||
| McLaughlin & Associates/Newsmax | November 21–23, 2020 | 442 (LV) | ± 3.1% | 4% | 2% | 4% | 9% | 53%[ig] | 6%[jo] | 15% | |||||
| Morning Consult/Politico | November 21–23, 2020 | 765 (RV) | ± 2% | 4% | – | 4% | 12% | 53% | 11%[jp] | – | |||||
| HarrisX/The Hill | November 17–19, 2020 | 599 (RV) | ± 2.26% | – | – | – | – | 75% | 25% | – | |||||
| Seven Letter Insight | November 10–19, 2020 | ~555 (V)[jq] | ± 2.5% | 6% | – | 7% | 19% | 35% | 4%[jr] | – | |||||
| Léger | November 13–15, 2020 | 304 (A)[js] | ± 3.09% | 7% | – | 4% | 22% | 45%[ig] | 5%[jt] | – | |||||
| 2020 presidential election | |||||||||||||||
| YouGov/Washington Examiner | October 30, 2020 | – (RV)[ju] | – | – | – | – | – | 38% | 43%[jv] | – | |||||
Head-to-head polling[edit]
Ron DeSantis versus Donald Trump head-to-head
| Graphs are unavailable due to technical issues. There is more info on Phabricator and on MediaWiki.org. |
| Poll source | Date(s) administered |
Sample size |
Ron DeSantis |
Donald Trump |
Undecided/ Other | ||
|---|---|---|---|---|---|---|---|
| Echelon Insights | March 27–29, 2023 | 370 (RV) | 34% | 59% | 7% | ||
| Harris Poll | March 22–23, 2023 | – | 44% | 56% | – | ||
| Premise | March 4–7, 2023 | 639 (RV) | 37% | 53% | 10% | ||
| Echelon Insights | February 17–23, 2023 | 419 (LV) | 42% | 53% | 5% | ||
| McLaughlin & Associates | February 17–23, 2023 | 441 (LV) | 38% | 56% | 6% | ||
| Big Village | February 15–17, 2023 | 346 (A) | 39% | 61% | – | ||
| Harris Poll | February 15–16, 2023 | – | 44% | 56% | – | ||
| WPA Intelligence | February 13–16, 2023 | 1,000 (RV) | 55% | 37% | 12% | ||
| Rasmussen Reports | February 8–12, 2023 | – | 32% | 45% | 23% | ||
| YouGov | February 2–6, 2023 | 453 (RV) | 45% | 41% | 14% | ||
| OnMessage | January 30 – February 5, 2023 | 1,000 (LV) | 53% | 38% | 9% | ||
| Monmouth University | January 26 – February 2, 2023 | 566 (RV) | 53% | 40% | 7% | ||
| Echelon Insights | January 23–25, 2023 | 467 (LV) | 48% | 43% | 9% | ||
| McLaughlin & Associates | January 19–24, 2023 | 457 (LV) | 41% | 52% | 7% | ||
| WPA Intelligence | January 17–23, 2023 | 3,015 (LV) | 49% | 40% | 11% | ||
| North Star Opinion Research | January 16–21, 2023 | 1,000 (LV) | 44% | 28% | 28% | ||
| 1,000 (LV) | 52% | 30% | 18% | ||||
| Big Village | January 18–20, 2023 | 355 (A) | 39% | 61% | – | ||
| Marquette University | January 9–20, 2023 | 352 (RV) | 64% | 36% | – | ||
| 401 (A) | 62% | 38% | – | ||||
| Harris Poll | January 18–19, 2023 | – | 45% | 55% | – | ||
| Schoen Cooperman Research | January 14–18, 2023 | – | 45% | 46% | 9% | ||
| YouGov | January 12–16, 2023 | 450 (RV) | 45% | 42% | 13% | ||
| Public Policy Polling | January 10–11, 2023 | 446 (LV) | 43% | 42% | 15% | ||
| YouGov | January 5–9, 2023 | 346 (A) | 51% | 49% | – | ||
| YouGov | December 15–19, 2022 | 390 (A) | 48% | 40% | 12% | ||
| 450 (RV) | 45% | 43% | 12% | ||||
| Harris Poll | December 14–15, 2022 | 666 (RV) | 52% | 48% | – | ||
| Echelon Insights | December 12–14, 2022 | 418 (RV) | 48% | 46% | 6% | ||
| 454 (LV) | 47% | 46% | 7% | ||||
| Morning Consult | December 10–14, 2022 | 825 (RV) | 45% | 44% | 9% | ||
| McLaughlin & Associates | December 9–14, 2022 | 480 (LV) | 36% | 58% | 6% | ||
| Suffolk University | December 7–11, 2022 | 374 (RV) | 56% | 33% | 11% | ||
| Fabrizio, Lee & Associates | December 3–7, 2022 | 267 (RV) | 52% | 38% | 10% | ||
| YouGov | December 1–5, 2022 | 435 (RV) | 47% | 42% | 11% | ||
| 521 (A) | 42% | 42% | 16% | ||||
| Marquette University | November 15–22, 2022 | 318 (A) | 60% | 40% | – | ||
| 383 (A) | 57% | 42% | – | ||||
| Quinnipiac University | November 16–20, 2022 | – | 45% | 43% | 13% | ||
| – | 44% | 44% | 12% | ||||
| Echelon Insights | November 17–19, 2022 | 424 (RV) | 40% | 52% | 8% | ||
| 424 (LV) | 46% | 46% | 8% | ||||
| YouGov | November 13–15, 2022 | 432 (A) | 46% | 39% | 15% | ||
| Léger | November 11–13, 2022 | 316 (A) | 45% | 43% | 12% | ||
| YouGov | November 9–11, 2022 | – | 42% | 35% | 23% | ||
| 2022 midterm elections | |||||||
| Echelon Insights | October 24–26, 2022 | 405 (RV) | 32% | 60% | 8% | ||
| 455 (LV) | 34% | 56% | 10% | ||||
| YouGov | October 11–26, 2022 | 1,720 (RV) | 45% | 55% | – | ||
| YouGov | October 13–17, 2022 | 473 (RV) | 36% | 45% | 19% | ||
| 570 (A) | 35% | 45% | 20% | ||||
| McLaughlin & Associates | October 12–17, 2022 | 454 (LV) | 29% | 64% | 7% | ||
| YouGov | September 23–27, 2022 | 456 (RV) | 34% | 46% | 20% | ||
| 573 (A) | 32% | 45% | 23% | ||||
| Echelon Insights | August 1 – September 7, 2022 | 490 (LV) | 35% | 57% | 8% | ||
| YouGov | September 2–6, 2022 | 467 (RV) | 37% | 49% | 14% | ||
| 547 (A) | 34% | 48% | 18% | ||||
| YouGov | August 18–22, 2022 | 460 (RV) | 31% | 49% | 20% | ||
| 547 (A) | 31% | 49% | 20% | ||||
| YouGov | July 28 – August 1, 2022 | 428 (LV) | 35% | 44% | 21% | ||
| 504 (A) | 34% | 44% | 22% | ||||
| Echelon Insight | July 15–18, 2022 | 408 (RV) | 30% | 59% | 11% | ||
| 431 (LV) | 32% | 56% | 12% | ||||
| YouGov | July 8–11, 2022 | 488 (RV) | 31% | 47% | 22% | ||
| 575 (A) | 29% | 50% | 21% | ||||
| YouGov | June 24–27, 2022 | 457 (RV) | 36% | 44% | 20% | ||
| 542 (A) | 33% | 45% | 27% | ||||
Mike Pence versus Donald Trump head-to-head
| Graphs are unavailable due to technical issues. There is more info on Phabricator and on MediaWiki.org. |
| Poll source | Date(s) administered |
Sample size |
Mike Pence |
Donald Trump |
Undecided/ Other |
|---|---|---|---|---|---|
| Public Policy Polling | January 10–11, 2023 | 446 (LV) | 25% | 65% | 10% |
| Fabrizio, Lee & Associates | December 3–7, 2022 | 270 (RV) | 28% | 63% | 9% |
| YouGov | June 24–27, 2022 | 457 (RV) | 18% | 65% | 17% |
| 542 (A) | 18% | 61% | 21% | ||
| YouGov | June 24–27, 2022 | 457 (RV) | 18% | 65% | 17% |
| 542 (A) | 18% | 61% | 21% | ||
| Echelon Insights | April 18–20, 2022 | 436 (RV) | 25% | 68% | 7% |
| 459 (LV) | 28% | 64% | 8% |
Polls without Donald Trump
| Graphs are unavailable due to technical issues. There is more info on Phabricator and on MediaWiki.org. |
| Poll source | Date(s) administered |
Sample size[b] |
Margin of error |
Tucker Carlson |
Ted Cruz |
Ron DeSantis |
Nikki Haley |
Josh Hawley |
Larry Hogan |
Mike Pence |
Mike Pompeo |
Vivek Ramaswamy |
Mitt Romney |
Marco Rubio |
Tim Scott |
Donald Trump Jr. |
Other | Undecided | |||||||
|---|---|---|---|---|---|---|---|---|---|---|---|---|---|---|---|---|---|---|---|---|---|---|---|---|---|
| HarrisX/The Messenger | August 24-28, 2023 | 685 (RV) | – | – | – | 33% | 6% | – | – | 12% | – | 23% | – | – | 3% | – | – | 9%[jw] | 14% | ||||||
| HarrisX/American Free Enterprise Chamber of Commerce | August 17–21, 2023 | 1,057 (LV) | – | – | – | 27% | 4% | – | – | 8% | – | 22% | – | – | 5% | – | 16%[jx] | 17% | |||||||
| Harvard/Harris | October 12–13, 2022 | 724 (RV) | – | – | 9% | 40% | 3% | – | – | 18% | 3% | – | – | 4% | 1% | – | 5% | 17% | |||||||
| Cygnal | October 10–12, 2022 | 1,204 (LV) | – | – | 4% | 46% | 4% | 0% | 1% | 17% | 2% | – | – | 2% | 1% | – | 11%[jy] | 14% | |||||||
| McLaughlin & Associates | September 17–22, 2022 | 465 (LV) | – | – | 6% | 31% | 3% | – | 2% | 11% | 3% | – | 2% | 2% | 1% | 19% | 13%[jz] | 12% | |||||||
| Echelon Insights | September 16–19, 2022 | 465 (LV) | – | – | 5% | 49% | 2% | 1% | 0% | 10% | 1% | – | 3% | 2% | 0% | 6% | 8%[ka] | 11% | |||||||
| Harvard/Harris | September 7–8, 2022 | 667 (RV) | – | – | 6% | 39% | 5% | – | – | 18% | 4% | – | – | 3% | 1% | – | 4% | 20% | |||||||
| McLaughlin & Associates | August 20–24, 2022 | 461 (LV) | – | – | 3% | 26% | 4% | – | 2% | 13% | 1% | – | 4% | 2% | 2% | 18% | 15%[kb] | 12% | |||||||
| Echelon Insights | August 19–22, 2022 | 459 (LV) | – | – | 5% | 41% | 5% | 0% | 1% | 10% | 0% | – | 1% | 1% | 0% | 11% | 7%[kc] | 17% | |||||||
| Harvard/Harris | July 27–28, 2022 | 679 (RV) | – | – | 7% | 34% | 7% | – | – | 19% | 3% | – | – | 3% | 1% | – | 3% | 22% | |||||||
| Echelon Insights | July 15–18, 2022 | 431 (LV) | – | – | 4% | 45% | 3% | 0% | 0% | 12% | 2% | – | 2% | 2% | 1% | 9% | 5%[kd] | 13% | |||||||
| Harvard/Harris | June 29–30, 2022 | 474 (RV) | – | – | 8% | 36% | 5% | – | – | 17% | 3% | – | – | 3% | 2% | – | 8% | 19% | |||||||
| McLaughlin & Associates | June 17–22, 2022 | 436 (LV) | – | – | 4% | 32% | 3% | – | 1% | 12% | 3% | – | 3% | 3% | 2% | 17% | 11%[ke] | 11% | |||||||
| Echelon Insights | June 17–20, 2022 | 409 (LV) | – | – | 6% | 39% | 3% | 1% | 0% | 18% | 0% | – | 3% | 2% | 0% | 7% | 5%[kf] | 15% | |||||||
| Zogby Analytics | May 23–24, 2022 | 408 (LV) | ± 4.9% | – | 12% | 27% | 4% | – | – | 23% | 3% | – | – | 5% | – | – | 13%[kg] | 15% | |||||||
| Echelon Insights | May 20–23, 2022 | 451 (LV) | – | – | 7% | 34% | 3% | 1% | 1% | 17% | 0% | – | 1% | 2% | 1% | 17% | 8%[kh] | 18% | |||||||
| Harvard/Harris | May 18–19, 2022 | – | – | – | 9% | 25% | 5% | – | – | 15% | 2% | – | – | 3% | 2% | – | 9% | 29% | |||||||
| McLaughlin & Associates | April 22–26, 2022 | 464 (LV) | – | – | 6% | 31% | 2% | – | 1% | 11% | 1% | – | 4% | 3% | 1% | 16% | 12%[ki] | 13% | |||||||
| Harvard/Harris | April 20–21, 2022 | 708 (RV) | – | – | 8% | 35% | 7% | – | – | 20% | 1% | – | – | 3% | 1% | – | 6% | 18% | |||||||
| Echelon Insights | April 18–20, 2022 | 459 (LV) | – | – | 7% | 35% | 6% | 0% | 2% | 15% | 2% | – | 2% | 3% | 1% | 5% | 4%[kj] | 17% | |||||||
| Harvard/Harris | March 23–24, 2022 | 719 (RV) | – | – | 10% | 28% | 6% | – | – | 24% | 3% | – | – | 5% | 2% | – | 5% | 16% | |||||||
| McLaughlin & Associates | March 17–22, 2022 | 459 (LV) | – | – | 5% | 26% | 4% | – | 1% | 15% | 2% | – | 3% | 2% | 1% | 16% | 7%[kk] | 17% | |||||||
| Echelon Insights | March 18–21, 2022 | 475 (LV) | – | – | 5% | 31% | 6% | 1% | 1% | 16% | 1% | – | 6% | 3% | 1% | 8% | 3%[kl] | 17% | |||||||
| Harvard/Harris | February 23–24, 2022 | 729 (RV) | – | – | 11% | 33% | 5% | – | – | 25% | 5% | – | – | 4% | 3% | – | 14% | – | |||||||
| Echelon Insights | February 19–23, 2022 | 451 (LV) | – | – | 8% | 27% | 5% | 1% | 1% | 18% | 2% | – | 2% | 3% | 1% | 7% | 10%[km] | – | |||||||
| McLaughlin & Associates | February 16–22, 2022 | 463 (LV) | – | – | 5% | 27% | 3% | – | 0% | 11% | 2% | – | 3% | 2% | 1% | 17% | 14%[kn] | 13% | |||||||
| Morning Consult/Politico | January 22–23, 2022 | 463 (RV) | – | – | 6% | 25% | 4% | – | 1% | 12% | 1% | – | 2% | 1% | 1% | 24% | 6%[ko] | – | |||||||
| Echelon Insights | January 21–23, 2022 | 423 (RV) | – | – | 6% | 28% | 4% | 0% | 1% | 16% | 0% | – | 6% | 1% | 2% | 11% | 6%[kp] | – | |||||||
| Harvard/Harris | January 19–20, 2022 | 1815 (RV) | – | – | 14% | 30% | 4% | – | – | 25% | 3% | – | – | 6% | 3% | – | – | – | |||||||
| McLaughlin & Associates | January 13–18, 2022 | 468 (LV) | – | – | 8% | 26% | 6% | – | 0% | 12% | 1% | – | 5% | 1% | 1% | 18% | 7%[kq] | 13% | |||||||
| Echelon Insights | December 9–13, 2021 | 439 (RV) | – | – | 8% | 30% | 3% | 1% | 0% | 12% | 1% | – | 4% | 2% | 1% | 8% | 8%[kr] | 19% | |||||||
| Harvard/Harris | November 30 – December 2, 2021 | 1989 (RV) | – | – | 13% | 30% | 7% | – | – | 25% | 4% | – | – | 8% | 4% | – | 10% | – | |||||||
| Echelon Insights[1] | November 12–18, 2021 | 435 (RV) | – | – | 10% | 26% | 6% | 1% | 0% | 15% | 1% | – | 3% | 1% | 1% | 13% | 5%[ks] | 20% | |||||||
| Harvard/Harris | October 26–28, 2021 | 490 (LV) | ±4.0% | – | 12% | 21% | – | – | – | 23% | – | – | – | – | – | – | 0% | 43% | |||||||
| Echelon Insights[2] | October 15–19, 2021 | 476 (RV) | – | 2% | 8% | 22% | 5% | 0% | 0% | 8% | 2% | – | 3% | 4% | 2% | 13% | 8%[kt] | 22% | |||||||
| McLaughlin & Associates | October 14–18, 2021 | 463 (LV) | – | – | 5% | 24% | 5% | – | – | 14% | 1% | – | 5% | 2% | 2% | 18% | 11%[ku] | 13% | |||||||
| Echelon Insights[3] | September 17–23, 2021 | 479 (RV) | – | 2% | 9% | 22% | 6% | 1% | 1% | 15% | 2% | – | 4% | 2% | 1% | 9% | 11%[kv] | 21% | |||||||
| Harvard/Harris | September 15–16, 2021 | 490 (LV) | ±4.0% | – | 14% | 20% | – | – | – | 32% | – | – | – | – | – | – | 0% | 38% | |||||||
| McLaughlin & Associates | September 9–14, 2021 | 456 (LV) | – | – | 7% | 22% | 4% | – | – | 15% | 2% | – | 4% | 2% | 2% | 19% | 12%[kw] | 11% | |||||||
| Emerson College | August 30 – September 1, 2021 | 395 (RV) | ± 4.9% | – | 13% | 32% | 10% | 6% | – | 24% | – | – | 6% | – | – | – | 9%[kx] | 0% | |||||||
| McLaughlin & Associates | July 29 – August 3, 2021 | 467 (LV) | – | – | 9% | 23% | 4% | – | – | 11% | 2% | – | 4% | 4% | 1% | 12% | 16%[ky] | 14% | |||||||
| Echelon Insights[4] | July 19–23, 2021 | 421 (RV) | – | 1% | 9% | 32% | 4% | 1% | 0%[kz] | 17% | 1% | – | 3% | 2% | 1% | 10% | 6%[la] | 13% | |||||||
| Fabrizio, Lee & Associates | July 6–8, 2021 | 800 (RV) | ± 3.5% | – | 7% | 39% | 4% | 0% | 1% | 15% | 1% | – | 3% | – | 2% | – | 4%[lb] | 24% | |||||||
| Echelon Insights[5] | June 18–22, 2021 | 386 (RV) | – | 1% | 6% | 21% | 6% | 0%[lc] | 0%[ld] | 14% | 0%[le] | – | 4% | 3% | 2% | 7% | 7%[lf] | 26% | |||||||
| McLaughlin & Associates | June 16–20, 2021 | 444 (LV) | – | – | 6% | 24% | 4% | – | – | 19% | 1% | – | 5% | 2% | 1% | 15% | 13%[lg] | 11% | |||||||
| McLaughlin & Associates | May 12–18, 2021 | 444 (LV) | – | 1% | 12% | 18% | 5% | – | – | 19% | 2% | – | 3% | 1% | 2% | 13% | 13%[lh] | 12% | |||||||
| Echelon Insights[6] | May 14–17, 2021 | 479 (RV) | – | 2% | 9% | 22% | 5% | 1% | 0%[li] | 14% | 1% | – | 4% | 1% | 3% | 6% | 9%[lj] | 19% | |||||||
| Trafalgar Group | April 30 – May 6, 2021 | – (LV)[lk] | – | – | 15% | 35% | 6% | 1% | – | 10% | – | – | 10% | – | – | – | 21%[ll] | – | |||||||
| Echelon Insights[7] | April 16–23, 2021 | 440 (RV) | – | 2% | 8% | 20% | 6% | 1% | 0%[lm] | 16% | 1% | – | 4% | 2% | 0%[ln] | 9% | 3%[lo] | 28% | |||||||
| McLaughlin & Associates | April 8–13, 2021 | 441 (LV) | – | 3% | 10% | 14% | 3% | – | – | 19% | 2% | – | 3% | 3% | 1% | 15% | 13%[lp] | 14% | |||||||
| Echelon Insights | March 15–21, 2021 | 1,008 (RV) | – | 4% | 5% | 17% | 4% | – | – | 16% | 4% | – | 3% | 2% | – | 3% | 7%[lq] | 35% | |||||||
| Fabrizio, Lee & Associates/The Hill[8] | February 20 – March 2, 2021 | 1,264 (LV) | ± 2.7% | – | 13% | 17% | 8% | 2% | 1% | 19% | 4% | – | 5% | 4% | 1% | – | 7%[lr] | 20% | |||||||
| McLaughlin & Associates | Feb 24–28, 2021 | 448 (LV) | – | 1% | 9% | 9% | 5% | – | – | 15% | – | – | 6% | 2% | – | 21% | 16%[ls] | 17% | |||||||
| RMG Research/Just the News | February 25–27, 2021 | 363 (RV) | – | 8% | 18% | 21% | 10% | 2% | – | – | 9% | – | – | – | – | – | 33%[lt] | – | |||||||
| Harvard/Harris | February 23–25, 2021 | 546 (RV) | – | – | 16% | – | 10% | 6% | – | 41% | – | – | – | – | 7% | – | 19%[lu] | – | |||||||
| Echelon Insights | February 12–18, 2021 | 430 (RV) | – | 1% | 10% | 8% | 6% | ≤1% | 1% | 21% | 1% | – | 4% | ≤1% | ≤1% | 8% | 12%[lv] | 26% | |||||||
| Echelon Insights | January 20–26, 2021 | – (RV)[lw] | – | 2% | 8% | 2% | 9% | 0% | 0% | 21% | 1% | – | 3% | 2% | 1% | 10% | 10%[lx] | 30% | |||||||
| Inauguration of Joe Biden | |||||||||||||||||||||||||
| Léger | January 15–17, 2021 | 1,007 (A)[ly] | ± 3.09% | – | 9% | 3% | 8% | 2% | 7% | 22% | 3% | – | 20% | 4% | 3% | 11% | 8%[lz] | – | |||||||
| McLaughlin & Associates/Newsmax | November 21–23, 2020 | 442 (LV) | ± 3.1% | 1% | 7% | 2% | 6% | – | – | 20% | 1% | – | 5% | 3% | 2% | 20% | 13%[ma] | 22% | |||||||
| Léger | November 13–15, 2020 | 304 (A)[mb] | ± 3.1% | 6% | 14% | – | 6% | – | – | 44% | 3% | – | 11% | 6% | – | – | 7%[mc] | – | |||||||
| 2020 presidential election | |||||||||||||||||||||||||
| McLaughlin & Associates | November 2–3, 2020 | 449 (LV) | – | 2% | 5% | 2% | 8% | – | – | 30% | – | – | 5% | 2% | 1% | 20% | 5%[md] | 21% | |||||||
| Echelon Insights | August 14–18, 2020 | 423 (LV) | – | 2% | 4% | – | 7% | 0% | 1% | 26% | – | – | – | 5% | 1% | 12% | 11%[me] | 29% | |||||||
| Léger | August 4–7, 2020 | 309 (LV) | ± 2.8% | 7% | 8% | – | 11% | – | – | 31% | 3% | – | 9% | 5% | – | 17% | 9%[mf] | – | |||||||
Statewide polling[edit]
Alabama primary[edit]
| Poll source | Date(s) administered |
Sample size[b] |
Margin of error |
Ron DeSantis |
Nikki Haley |
Donald Trump |
Other | Undecided |
|---|---|---|---|---|---|---|---|---|
| Cygnal/Alabama Daily News | Jan 29–30, 2024 | 515 (LV) | ± 4.31% | – | 16% | 76% | – | 8% |
| Public Opinion Strategies[C] | Jan 15–17, 2023 | 500 (LV) | ± 4.38% | 50% | – | 31% | – | 19% |
| 53% | – | 35% | – | 12% | ||||
| Cygnal/Alabama Daily News | Oct 27–29, 2022 | 616 (LV) | ± 3.94% | 36% | 1% | 50% | 5% | 8% |
Arizona primary[edit]
| States polled |
Dates administered |
Dates updated |
Nikki Haley |
Donald Trump |
Other/ Undecided[mg] |
Margin |
|---|---|---|---|---|---|---|
| FiveThirtyEight | through February 4, 2024 | March 5, 2024 | 19.9% | 77.3% | 2.8% | Trump +57.4 |
| Poll source | Date(s) administered |
Sample size[b] |
Margin of error |
Chris Christie |
Ron DeSantis |
Nikki Haley |
Asa Hutchinson |
Mike Pence |
Vivek Ramaswamy |
Tim Scott |
Donald Trump |
Other | Undecided |
|---|---|---|---|---|---|---|---|---|---|---|---|---|---|
| Noble Predictive Insights | October 25–31, 2023 | 348 (RV) | ± 5.25% | 2% | 16% | 8% | 0% | 3% | 9% | 1% | 53% | 7%[mh] | – |
| – | 32% | – | – | – | – | – | 68% | – | – | ||||
| Emerson College | August 2–4, 2023 | 663 (LV) | ± 3.7% | 6% | 11% | 3% | 0% | 3% | 4% | 3% | 58% | 11%[mi] | 1% |
| Noble Predictive Insights | July 13–17, 2023 | 346 (RV) | ± 5.3% | 2% | 19% | 4% | 0% | 5% | 9% | 2% | 50% | 7%[mj] | – |
| – | 38% | – | – | – | – | – | 62% | – | – | ||||
| J.L. Partners | Apr 10–12, 2023 | 550 (LV) | ± 4.2% | – | 24% | 3% | 0% | 4% | 2% | 1% | 47% | 8%[mk] | 11% |
| – | 35% | – | – | – | – | – | 52% | – | 13% | ||||
| Noble Predictive Insights | Apr 4–11, 2023 | 371 (RV) | ± 5.1% | – | 21% | 4% | – | 7% | – | 0% | 49% | 20%[ml] | – |
| – | 41% | – | – | – | – | – | 59% | – | – | ||||
| Rasmussen Reports | Mar 13–14, 2023 | – | – | – | 24% | – | – | – | – | – | 52% | – | 24% |
| OH Predictive Insights | Jan 31 – Feb 9, 2023 | 350 (RV) | ± 5.2% | 1% | 26% | 5% | – | 8% | – | – | 42% | 11%[mm] | 7% |
| Blueprint Polling | Jan 5–8, 2023 | 303 (V) | – | – | 34% | – | – | – | – | – | 43% | – | 23% |
| Echelon Insights | Aug 31 – Sep 7, 2022 | 337 (LV) | ± 4.5% | – | 36% | – | – | – | – | – | 53% | – | 11% |
| OH Predictive Insights | Nov 1–8, 2021 | 252 (RV) | ± 6.2% | 1% | 16% | 6% | – | 9% | – | – | 48% | 9%[mn] | 9% |
| 0% | 29% | 8% | – | 21% | – | – | – | 25%[mo] | 16% |
Arkansas primary[edit]
| Poll source | Date(s) administered |
Sample size[b] |
Margin of error |
Ron DeSantis |
Donald Trump |
Undecided |
|---|---|---|---|---|---|---|
| Echelon Insights | Aug 31 – Sep 7, 2022 | 184 (LV) | ± 7.7% | 29% | 58% | 13% |
California primary[edit]
- Aggregate polls
| Source of poll aggregation |
Dates administered |
Dates updated |
Nikki Haley |
Donald Trump |
Other/ Undecided[mp] |
Margin |
|---|---|---|---|---|---|---|
| FiveThirtyEight | through February 4, 2024 | February 10, 2024 | 19.0% | 73.1% | 7.9% | Trump +54.1 |
| Poll source | Date(s) administered |
Sample size[b] |
Margin of error |
Chris Christie |
Ron DeSantis |
Larry Elder |
Nikki Haley |
Asa Hutchinson |
Mike Pence |
Vivek Ramaswamy |
Tim Scott |
Donald Trump |
Other | Undecided |
|---|---|---|---|---|---|---|---|---|---|---|---|---|---|---|
| Morning Consult | Nov 1–30, 2023 | 2,347 (LV) | – | 2% | 10% | – | 8% | 0% | – | 7% | – | 71% | 1%[mq] | – |
| Public Policy Institute of California | Nov 9–16, 2023 | 276 (LV) | – | 5% | 12% | – | 13% | 0% | – | 2% | 2% | 56% | 1%[mr] | 9% |
| Emerson College | Nov 11–14, 2023 | 331 (LV) | – | 4% | 11% | - | 5% | 2% | – | 3% | - | 63% | 1%[ms] | 11% |
| UC Berkeley IGS | Oct 24–30, 2023 | 1,234 (LV) | ± 4.0% | 2% | 12% | 1% | 9% | – | – | 3% | 1% | 57% | 5% | 11% |
| Public Policy Institute of California | Oct 3–19, 2023 | 316 (LV) | – | 4% | 12% | 0% | 9% | 0% | 6% | 5% | 3% | 53% | 5%[mt] | 1% |
| Data Viewpoint | October 1, 2023 | 533 (RV) | ± 4.3% | 5.5% | 17.5% | – | 15.2% | <1% | 3.0% | 3.6% | 2.9% | 49.8% | 1.7%[mu] | – |
| California's Choice | Aug 27–29, 2023 | 750 (LV) | – | 4.8% | 21.6% | – | 15.6% | 0.5% | 4.4% | 9.6% | 0.8% | 43.4% | 2.6% | – |
| UC Berkeley IGS | Aug 24–29, 2023 | 1,175 (LV) | ± 4.0% | 3% | 16% | 1% | 7% | – | 3% | 4% | 2% | 55% | – | 9% |
| Public Policy Institute of California | Jun 7–29, 2023 | 267 (LV) | – | 3% | 24% | – | 3% | – | 6% | 1% | 5% | 50% | 7%[mv] | 1% |
| Emerson College | Jun 4–7, 2023 | 329 (LV) | ± 2.9% | 2% | 19% | – | 6% | – | 10% | 2% | 4% | 53% | 7%[mw] | – |
| Public Policy Institute of California | May 17–24, 2023 | 295 (LV) | ± 7% | 1% | 21% | – | 3% | – | 10% | 1% | 2% | 50% | 11%[mx] | 2% |
| UC Berkeley IGS | May 17–22, 2023 | 1,835 (RV) | ± 3.5% | 1% | 26% | 0% | 3% | 0% | 4% | 2% | 1% | 44% | 6%[my] | 13% |
| UC Berkeley IGS | Feb 14–20, 2023 | 1,755 (RV) | ± 3.5% | – | 37% | – | 7% | – | 3% | – | 1% | 29% | 8%[mz] | 10% |
| – | 50% | – | – | – | – | – | – | 33% | 6%[na] | 11% | ||||
| UC Berkeley IGS | Aug 9–15, 2022 | 9,254 (RV) | ± 3.0% | 0% | 27% | – | 3% | – | 7% | – | 0% | 38% | 10%[nb] | 14% |
| 0% | 53% | – | 4% | – | 9% | – | 1% | – | 15%[nc] | 17% |
Florida primary[edit]
- Aggregate polls
| Source of poll aggregation |
Dates administered |
Dates updated |
Nikki Haley |
Donald Trump |
Other/ Undecided[nd] |
Margin |
|---|---|---|---|---|---|---|
| FiveThirtyEight | through February 4, 2024 | February 10, 2024 | 14.1% | 84.2% | 1.7% | Trump +70.1 |
| Poll source | Date(s) administered |
Sample size[b] |
Margin of error |
Chris Christie |
Ron DeSantis |
Nikki Haley |
Asa Hutchinson |
Mike Pence |
Vivek Ramaswamy |
Tim Scott |
Donald Trump |
Others | Undecided | |||
|---|---|---|---|---|---|---|---|---|---|---|---|---|---|---|---|---|
| Victory Insights | Dec 8–9, 2023 | 1,220 (LV) | ± 2.9% | 5.3% | 18.8% | 7.6% | – | – | 1.3% | – | 59.5% | 2.7% | 4.8% | |||
| – | 25.8% | – | – | – | – | – | 56.8% | – | 17.4% | |||||||
| Florida Atlantic University Political Communication & Public Opinion Research Lab/ Mainstreet Research |
Oct 27 – November 11, 2023 | 400 (RV) | – | 1% | 20% | 9% | – | – | 0% | – | 61% | 2%[ne] | 6% | |||
| – | 30% | – | – | – | – | – | 63% | – | 7% | |||||||
| University of North Florida | Oct 23 – November 4, 2023 | 788 (LV) | ± 3.77% | 2% | 21% | 6% | <1% | 1% | 1% | <1% | 60% | <2%[nf] | 8% | |||
| – | 29% | – | – | – | – | – | 59% | – | 12% | |||||||
| Fabrizio, Lee & Associates | Oct 1–2, 2023 | 500 (LV) | – | 2% | 22% | 7% | – | 1% | 1% | 1% | 57% | 0% | 7% | |||
| Victory Insights | Aug 21–23, 2023 | 590 (LV) | ± 4.3% | 4% | 23% | 2% | 2% | 1% | 3% | 1% | 59% | 1% | 7% | |||
| – | 30% | – | – | – | – | – | 57% | – | 13% | |||||||
| Florida Atlantic University | Jun 27 – July 1, 2023 | 315 (RV) | – | 2% | 30% | 1% | 2% | 2% | 4% | 3% | 50% | – | 7% | |||
| – | 37% | – | – | – | – | – | 54% | – | 8% | |||||||
| Breakthrough Research/Sachs Media | Jun 9–11, 2023 | – | – | 2% | 41% | 2% | 0% | 3% | 2% | 0% | 41% | 0%[ng] | 8% | |||
| Victory Insights | May 25–27, 2023 | 700 (LV) | ± 3.9% | – | 38% | 3% | – | 3% | 0% | 3% | 38% | 4%[nh] | 12% | |||
| – | 40% | – | – | – | – | – | 39% | – | 21% | |||||||
| National Research[D] | May 8–9, 2023 | 500 (LV) | ± 4.4% | – | 34% | 2% | 0% | 2% | 2% | 1% | 42% | 1%[ni] | 16% | |||
| Florida Atlantic University | Apr 13–14, 2023 | 1,081 (RV) | ± 3.0% | – | 31% | – | – | – | – | – | 59% | – | – | |||
| Victory Insights | Apr 6–8, 2023 | 1,000 (LV) | ± 3.1% | – | 35% | 3% | 1% | – | 4% | – | 43% | – | 14% | |||
| – | 32% | – | – | – | – | – | 47% | – | 22% | |||||||
| Emerson College | Mar 13–15, 2023 | 1,153 (RV) | ± 2.8% | – | 44% | 2% | – | 4% | – | 1% | 47% | 3%[nj] | – | |||
| University of North Florida | Feb 25 – March 7, 2023 | 550 (RV) | ± 2.6% | – | 59% | – | – | – | – | – | 28% | – | 13% | |||
| – | 52% | 4% | – | 2% | – | 0% | 27% | 4%[nk] | 11% | |||||||
| Victory Insights | Nov 16–17, 2022 | 700 (LV) | ± 3.7% | – | 47% | – | – | – | – | – | 37% | – | 10% | |||
| WPA Intelligence[E] | Nov 11–13, 2022 | 1,044 (LV) | – | – | 56% | – | – | – | – | – | 30% | – | 14% | |||
| 2022 midterm elections | ||||||||||||||||
| Victory Insights | Oct 30 – November 1, 2022 | 229 (LV) | ± 4.8% | – | 50% | – | – | – | – | – | 50% | – | – | |||
| Suffolk University | Sep 15–18, 2022 | 174 (LV) | – | – | 48% | – | – | – | – | – | 40% | – | 12% | |||
| Echelon Insights | Aug 31 – September 7, 2022 | 363 (LV) | ± 4.3% | – | 45% | – | – | – | – | – | 47% | – | 8% | |||
| University of North Florida | Aug 8–12, 2022 | 671 (RV) | ± 3.4% | – | 47% | – | – | – | – | – | 45% | – | 8% | |||
| WPA Intelligence[E] | Aug 7–10, 2022 | 1,000 (LV) | – | – | 49% | – | – | – | – | – | 42% | – | 9% | |||
| Victory Insights | Jul 13–14, 2022 | 600 (RV) | ± 4.1% | – | 61% | – | – | – | – | – | 39% | – | 0% | |||
| Blueprint Polling (D) | Jul 7–10, 2022 | 656 (V) | ± 3.8% | – | 51% | – | – | – | – | – | 39% | – | 10% | |||
| Bendixen/Amandi International | March 2022 | – | – | – | 32% | – | – | – | – | – | 55% | – | 13% | |||
| University of North Florida | Feb 7–20, 2022 | 259 (RV) | – | – | 44% | – | – | – | – | – | 41% | – | 15% | |||
| Suffolk University | Jan 26–29, 2022 | 176 (LV) | – | – | 40% | – | – | – | – | – | 47% | – | 13% | |||
| Victory Insights | Sep 16–18, 2021 | 200 (LV) | – | – | 30% | – | – | – | – | – | 58% | – | 12% | |||
| Susquehanna Polling & Research (R) | Aug 4–10, 2021 | 280 (RV) | – | 1% | 34% | 3% | – | – | – | – | 43% | 10%[nl] | 8% | |||
| Fabrizio, Lee & Associates | Feb 15–17, 2021 | 304 (LV) | – | – | 64% | – | – | – | – | – | – | 22% [nm] | 14% | |||
| Inauguration of Joe Biden | ||||||||||||||||
| 2020 presidential election | ||||||||||||||||
| Fabrizio, Lee & Associates | July 16–18, 2019 | 280 (LV) | – | – | 37% | – | – | – | – | – | – | 44%[nn] | 19% | |||
Georgia primary[edit]
| States polled |
Dates administered |
Dates updated |
Nikki Haley |
Donald Trump |
Other/ Undecided[no] |
Margin |
|---|---|---|---|---|---|---|
| FiveThirtyEight | through February 4, 2024 | March 5, 2024 | 16.3% | 81.1% | 2.6% | Trump +64.8 |
| Poll source | Date(s) administered |
Sample size[b] |
Margin of error |
Doug Burgum |
Chris Christie |
Ron DeSantis |
Nikki Haley |
Asa Hutchinson |
Mike Pence |
Vivek Ramaswamy |
Tim Scott |
Donald Trump |
Other | Undecided |
|---|---|---|---|---|---|---|---|---|---|---|---|---|---|---|
| CNN/SSRS | Nov 30 – Dec 7, 2023 | 522 (LV) | ± 3.3% | – | 4% | 17% | 17% | 1% | – | 3% | – | 55% | 2%[np] | 2% |
| – | 37% | – | – | – | – | – | – | 61% | – | 2% | ||||
| – | – | 31% | – | – | – | – | – | 69% | – | – | ||||
| Morning Consult | Nov 1–30, 2023 | 1,477 (LV) | – | 0% | 2% | 14% | 10% | 0% | – | 6% | 1% | 66% | – | 1% |
| Morning Consult | Oct 1–31, 2023 | 1,525 (LV) | – | 0% | 2% | 15% | 6% | 0% | 3% | 8% | 2% | 63% | 0%[nq] | 1% |
| Zogby Analytics | Oct 9–12, 2023 | 273 (LV) | ± 3.9% | – | 3% | 10% | 9% | – | 5% | 7% | 5% | 55% | – | 6% |
| Morning Consult | Sep 1–30, 2023 | 1,452 (LV) | – | – | 1% | 15% | 6% | 1% | 4% | 10% | 3% | 61% | 0%[nr] | – |
| 20/20 Insights | Sep 25–28, 2023 | 245 (LV) | ± 6.3% | 0% | 4% | 16% | 7% | 0% | 4% | 3% | 2% | 58% | – | 6% |
| Morning Consult | Aug 1–31, 2023 | 1,599 (LV) | – | 0% | 1% | 14% | 4% | 0% | 5% | 10% | 3% | 62% | 0%[ns] | 1% |
| University of Georgia | Aug 16–23, 2023 | 807 (LV) | ± 3.4% | 0% | 2% | 15% | 3% | 0% | 4% | 3% | 3% | 57% | 1%[nt] | 14% |
| Morning Consult | July 1–31, 2023 | 1,633 (LV) | – | 0% | 1% | 19% | 3% | 0% | 6% | 9% | 3% | 57% | 1%[nu] | 1% |
| Morning Consult | June 1–30, 2023 | 1,599 (LV) | – | 0% | 2% | 22% | 3% | 1% | 6% | 3% | 3% | 58% | 0%[nv] | 2% |
| Morning Consult | May 1–31, 2023 | 1,470 (LV) | – | – | – | 21% | 3% | 0% | 6% | 3% | 2% | 61% | 1%[nw] | 3% |
| Landmark Communications | May 14, 2023 | 800 (LV) | ± 3.5% | – | 2% | 32% | 6% | – | 2% | 2% | 2% | 40% | 7%[nx] | 6% |
| Morning Consult | Apr 1–30, 2023 | 1,403 (LV) | – | – | – | 22% | 4% | 0% | 7% | 3% | 2% | 58% | 4%[ny] | 2% |
| University of Georgia | Apr 2–12, 2023 | 983 (LV) | ± 3.1% | – | – | 30% | 4% | – | 2% | – | 1% | 51% | 3%[nz] | 7% |
| – | – | 41% | – | – | – | – | – | 51% | – | - | ||||
| Morning Consult | Mar 1–31, 2023 | 1,426 (LV) | – | – | – | 29% | 4% | – | 8% | 1% | 1% | 53% | 3%[oa] | 1% |
| Morning Consult | Feb 1–28, 2023 | 1,280 (LV) | – | – | – | 32% | 5% | – | 7% | 0% | 2% | 50% | 4%[ob] | - |
| Morning Consult | Jan 1–31, 2023 | 1,714 (LV) | – | – | – | 33% | 3% | – | 8% | – | 1% | 50% | 6%[oc] | - |
| Morning Consult | Dec 1–31, 2022 | 972 (LV) | – | – | – | 35% | 3% | – | 8% | – | 1% | 47% | 3%[od] | 3% |
| WPA Intelligence[F] | Nov 11–13, 2022 | 843 (LV) | ± 3.4% | – | – | 55% | – | – | – | – | – | 35% | – | 10% |
| 2022 midterm elections | ||||||||||||||
| Echelon Insights | Oct 31 – Nov 2, 2022 | 219 (LV) | ± 5.4% | – | – | 52% | – | – | – | – | – | 36% | – | 12% |
| Echelon Insights | Aug 31 – Sep 7, 2022 | 337 (LV) | ± 4.4% | – | – | 37% | – | – | – | – | – | 54% | – | 9% |
| Phillips Academy | Aug 3–7, 2022 | 371 (RV) | ± 5.1% | – | – | 29% | – | – | 9% | – | – | 54% | – | 8% |
| John Bolton Super PAC | Jul 22–24, 2022 | 163 (LV) | – | – | 5% | 36% | – | – | 6% | – | – | 29% | 16%[oe] | 19% |
| Spry Strategies | Apr 6–10, 2022 | 600 (LV) | ± 4.0% | – | – | 20% | 6% | – | 5% | – | 1% | 43% | 11%[of] | 15% |
| – | 39% | 6% | – | 7% | – | 2% | – | 15%[og] | 31% | |||||
| Trafalgar Group (R) | Mar 7–9, 2021 | – (LV)[oh] | – | – | – | – | – | – | – | – | – | 70% | 18%[oi] | 12% |
| Inauguration of Joe Biden | ||||||||||||||
| University of Nevada/BUSR | Dec 30, 2020 – Jan 3, 2021 | 209 (LV) | ± 7.0% | – | 1% | – | 3% | – | – | – | – | 73% | 12%[oj] | – |
| - | 1% | – | 8% | – | 36% | – | – | – | 31%[ok] | 24% | ||||
Illinois primary[edit]
| Poll source | Date(s) administered |
Sample size[2] |
Margin of error |
Chris Christie |
Ron DeSantis |
Nikki Haley |
Mike Pence |
Vivek Ramaswamy |
Tim Scott |
Donald Trump |
Other | Undecided |
|---|---|---|---|---|---|---|---|---|---|---|---|---|
| Cor Strategies | Aug 24–27, 2023 | – | – | 6% | 10% | 6% | 5% | 5% | 2% | 53% | 2%[ol] | 9% |
| 6% | 26% | 10% | 10% | 16% | 9% | – | 8%[om] | 16% | ||||
| Public Policy Polling | Jun 6–7, 2022 | 677 (LV) | – | 2% | 23% | 3% | 6% | – | 2% | 51% | 5%[on] | 8% |
Indiana primary[edit]
| Poll source | Date(s) administered |
Sample size |
Margin of error |
Ron DeSantis |
Nikki Haley |
Mike Pence |
Donald Trump |
Other | Undecided |
|---|---|---|---|---|---|---|---|---|---|
| Bellwether Research & Consulting | Dec 11–17, 2022 | 457 (LV) | – | 28% | 3% | 13% | 39% | 1%[oo] | 15% |
Iowa caucus[edit]

- Aggregate polls
| Source of poll aggregation |
Dates administered |
Dates updated |
Ron DeSantis |
Nikki Haley |
Asa Hutchinson |
Vivek Ramaswamy |
Donald Trump |
Other/ Undecided[op] |
Margin |
|---|---|---|---|---|---|---|---|---|---|
| 270toWin | January 11–15, 2024 | January 15, 2024 | 15.7% | 18.5% | 0.8% | 6.8% | 52.5% | 5.7%[oq] | Trump +34.0 |
| FiveThirtyEight | Through January 14, 2024 | January 15, 2024 | 15.8% | 18.7% | 0.7% | 6.4% | 52.7% | 5.7% | Trump +34.0 |
| RealClearPolling | January 5–14, 2024 | January 15, 2024 | 15.7% | 18.8% | 0.8% | 6.8% | 52.5% | 5.4% | Trump +33.7 |
| Average | 15.7% | 18.7% | 0.7% | 6.7% | 52.6% | 5.6% | Trump +33.9 | ||
| Poll source | Date(s) administered |
Sample size[b] |
Margin of error |
Doug Burgum |
Chris Christie |
Ron DeSantis |
Larry Elder |
Nikki Haley |
Asa Hutchinson |
Mike Pence |
Vivek Ramaswamy |
Tim Scott |
Donald Trump |
Other | Undecided |
|---|---|---|---|---|---|---|---|---|---|---|---|---|---|---|---|
| Trafalgar Group | Jan 12–14, 2024 | 1,092 (LV) | ± 2.9% | – | – | 19.3% | – | 18.5% | 0.7% | – | 6.5% | – | 52.1% | – | 2.9% |
| Selzer & Co.[G] | Jan 7–12, 2024 | 705 (LV) | ± 3.7% | – | – | 16% | – | 20% | 1% | – | 8% | – | 48% | 3%[or] | 5% |
| Insider Advantage | January 11, 2024 | 850 (LV) | ± 4.3% | – | – | 17% | – | 17% | 0% | – | 7% | – | 51% | – | 8% |
| Suffolk University | Jan 6–10, 2024 | 500 (LV) | ± 4.4% | – | – | 13% | – | 20% | 0% | – | 6% | – | 54% | – | – |
| Civiqs | Jan 5–10, 2024 | 433 (LV) | ± 6.4% | – | 4% | 14% | – | 14% | 0% | – | 8% | – | 55% | 2% | 3% |
| InsiderAdvantage | Dec 18–19, 2023 | 850 (LV) | ± 4.36% | – | 4% | 15% | – | 17% | 0% | – | 8% | – | 50% | – | 6% |
| Fox Business | Dec 14–18, 2023 | 804 (LV) | ± 3.5% | – | 3% | 18% | – | 16% | 0% | – | 7% | – | 52% | 1% | 2% |
| Emerson College | Dec 15–17, 2023 | 420 (LV) | ± 4.7% | – | 4% | 15% | – | 17% | 0% | – | 8% | – | 50% | – | 6% |
| Iowa State University/Civiqs | Dec 8–13, 2023 | 438 (LV) | ± 6.0% | – | 4% | 17% | – | 15% | 1% | – | 7% | – | 54% | 0%[os] | 2% |
| Selzer & Co.[G] | Dec 2–7, 2023 | 502 (LV) | ± 4.4% | – | 4% | 19% | – | 16% | 1% | – | 5% | – | 51% | 2%[ot] | 3% |
| Trafalgar Group | Dec 1–4, 2023 | 1,091 (LV) | ± 2.9% | 2% | 4% | 22% | – | 19% | 1% | – | 5% | – | 45% | – | 1% |
| Morning Consult | Nov 1–30, 2023 | 324 (LV) | – | 1% | 2% | 18% | – | 11% | 0% | – | 13% | 5% | 50% | – | – |
| Iowa State University/Civiqs | Nov 10–15, 2023 | 432 (LV) | ± 4.3% | 1% | 3% | 18% | – | 12% | 0% | – | 6% | 2% | 54% | 0% | 4% |
| Arc Insights[H] | Nov 9–14, 2023 | 800 (LV) | ± 3.5% | 1% | 4% | 17% | – | 17% | <1% | – | 5% | – | 44% | 2%[ou] | 9% |
| Fabrizio, Lee & Associates[I] | Nov 9–12, 2023 | 600 (LV) | ± 4.0% | 1% | 5% | 19% | - | 16% | 0% | - | 4% | 5% | 43% | 0% | 7% |
| 2% | 5% | 20% | - | 18% | 0% | - | 5% | - | 44% | 0% | 7% | ||||
| Trafalgar Group (R) | Nov 3–5, 2023 | 1,084 (LV) | ± 2.9% | 4% | 5% | 18% | – | 15% | 0% | – | 5% | 9% | 44% | 0%[ov] | 1% |
| Morning Consult | Oct 1–31, 2023 | 324 (LV) | – | 1% | 2% | 15% | – | 7% | 0% | 3% | 9% | 6% | 57% | – | – |
| Public Opinion Strategies[J] | Oct 24–26, 2023 | 400 (LV) | ± 4.9% | 1% | 2% | 20% | – | 12% | 1% | 1% | 4% | 5% | 46% | – | – |
| Selzer & Co.[G] | Oct 22–26, 2023 | 404 (LV) | ± 4.9% | 3% | 4% | 16% | – | 16% | 1% | 2%[ow] | 4% | 7% | 43% | 2%[ox] | 3% |
| Fabrizio, Lee & Associates[I] | Oct 17–19, 2023 | 600 (LV) | ± 4.0% | 2% | 3% | 21% | 0% | 14% | 0% | 2% | 4% | 5% | 42% | 2%[oy] | 6% |
| Iowa State University/Civiqs | Oct 6–10, 2023 | 425 (LV) | ± 6.1% | 0% | 2% | 17% | 0% | 11% | 0% | 1% | 5% | 4% | 55% | 2%[oz] | 1% |
| Morning Consult | Sep 1–30, 2023 | 316 (LV) | – | 1% | 5% | 13% | – | 6% | – | 7% | 9% | 7% | 53% | – | – |
| CBS News/YouGov | Sep 15–24, 2023 | 458 (LV) | ± 6.1% | 0% | 1% | 21% | 0% | 8% | 1% | 6% | 5% | 6% | 51% | 0%[pa] | – |
| Public Opinion Strategies[K] | Sep 19–21, 2023 | 400 (LV) | ± 4.9% | 1% | 2% | 21% | – | 9% | 0% | 2% | 5% | 6% | 45% | – | 9% |
| Fabrizio, Lee & Associates[L] | Sep 17–19, 2023 | 500 (LV) | ± 4.4% | 1% | 5% | 15% | – | 13% | <1% | 2% | 5% | 5% | 45% | <1%[pb] | 7% |
| Trafalgar Group (R) | Sep 14–18, 2023 | 1,079 (LV) | ± 2.9% | 4% | 2% | 16% | 0% | 8% | 0% | 4% | 7% | 7% | 49% | 1%[pc] | 2% |
| Fox Business | Sep 14–18, 2023 | 813 (LV) | ± 3% | 2% | 3% | 15% | <0.5% | 11% | <0.5% | 3% | 7% | 7% | 46% | 3%[pd] | 2% |
| Emerson College | Sep 7–9, 2023 | 357 (V) | ± 5.1% | 3% | – | 14% | – | 7% | – | 3% | 7% | 8% | 49% | 6% | – |
| Civiqs | Sep 2–7, 2023 | 434 (LV) | ± 5.8% | 2% | 3% | 14% | – | 10% | 0% | 1% | 9% | 6% | 51% | 1%[pe] | – |
| Public Opinion Strategies | Sep 5–6, 2023 | 400 (LV) | ± 4.9% | 1% | 3% | 22% | – | 6% | 1% | 2% | 6% | 5% | 45% | – | – |
| Morning Consult | Aug 1–31, 2023 | 341 (LV) | – | 1% | 4% | 15% | – | 6% | 0% | 6% | 8% | 7% | 52% | 0%[pf] | 1% |
| Fabrizio, Lee & Associates | Aug 25–28, 2023 | 500 (LV) | – | 2% | 3% | 18% | <1% | 10% | 1% | 2% | 7% | 7% | 44% | <2%[pg] | 5% |
| Public Opinion Strategies | August 24, 2023 | 400 (LV) | ± 4.9% | 1% | 1% | 21% | – | 11% | 1% | 2% | 7% | 7% | 41% | – | – |
| Public Opinion Strategies | Aug 19–21, 2023 | 400 (LV) | ± 4.9% | 3% | 3% | 14% | – | 3% | <1% | 2% | 10% | 3% | 42% | – | – |
| HarrisX[M] | Aug 17–21, 2023 | 1,120 (LV) | –[ph] | 2% | 3% | 11% | 0% | 4% | 0% | 3% | 9% | 8% | 45% | 3%[pi] | 12% |
| –[pj] | 2% | 4% | 21% | 1% | 6% | 1% | 8% | 18% | 15% | – | 4%[pk] | 19% | |||
| Echelon Insights[N] | Aug 15–17, 2023 | 800 (LV) | ± 4.2% | 2% | 4% | 17% | – | 2% | <1% | 3% | 8% | 3% | 33% | 3%[pl] | 14% |
| Selzer & Co.[G] | Aug 13–17, 2023 | 406 (LV) | ± 4.9% | 2% | 5% | 19% | – | 6% | – | 6% | 4% | 9% | 42% | 1%[pm] | 5% |
| The Trafalgar Group (R) | Aug 14–16, 2023 | 1,126 (LV) | ± 2.9% | 3% | 4% | 16% | 1% | 5% | 1% | 4% | 6% | 13% | 42% | 3%[pn] | 3% |
| New York Times/Siena College | Jul 28 – August 1, 2023 | 432 (LV) | ± 5.9% | 1% | <1% | 20% | <1% | 4% | <1% | 3% | 5% | 9% | 44% | <2%[po] | 12% |
| – | – | 39% | – | – | – | – | – | – | 55% | – | 4% | ||||
| Manhattan Institute | Jul 2023 | 625 (LV) | – | 3% | 4% | 17% | 0% | 5% | 1% | 4% | 6% | 10% | 42% | 1%[pp] | 7% |
| Morning Consult | July 1–31, 2023 | 350 (LV) | – | 1% | 2% | 19% | – | 4% | 0% | 4% | 8% | 5% | 55% | – | 2% |
| National Research[O] | Jul 23–24, 2023 | 500 (LV) | ± 4.4% | 3% | 4% | 15% | – | 3% | 0% | 2% | 5% | 9% | 42% | – | 13% |
| Fox Business | Jul 15–19, 2023 | 806 (LV) | ± 3.5% | 3% | 3% | 16% | <1% | 5% | 1% | 4% | 6% | 11% | 46% | 1%[pq] | 4% |
| co/efficient[P] | Jul 15–17, 2023 | 2,238 (LV) | ± 2.6% | – | 3% | 16% | – | 3% | – | 3% | 5% | 10% | 46% | – | 10% |
| National Research[O] | Jul 5–6, 2023 | 500 (LV) | ± 4.4% | – | 3% | 21% | – | 2% | 1% | 3% | 3% | 7% | 44% | – | 14% |
| Morning Consult | June 1–30, 2023 | 317 (LV) | – | 0% | 1% | 18% | – | 2% | 1% | 7% | 3% | 3% | 64% | 0%[pr] | 1% |
| McLaughlin & Associates[P] | Jun 10–12, 2023 | 500 (LV) | ± 4.4% | – | – | 19% | – | – | – | 6% | – | 9% | 51% | – | 15% |
| – | – | 33% | – | – | – | – | – | – | 60% | – | 7% | ||||
| National Research[O] | Jun 5–7, 2023 | 500 (LV) | ± 4.4% | – | 2% | 24% | – | 4% | 0% | 4% | 1% | 5% | 39% | – | 21% |
| Victory Insights | Jun 3–6, 2023 | 450 (LV) | ± 4.9% | – | 3% | 21% | – | 5% | – | 5% | 2% | 6% | 44% | 3%[ps] | 12% |
| – | – | 32% | – | – | – | – | – | – | 49% | – | 19% | ||||
| WPA Intelligence[Q] | May 30 – June 1, 2023 | 655 (RV) | – | – | – | 29% | – | 6% | <1% | 4% | 4% | 7% | 39% | – | 11% |
| – | – | 43% | – | – | – | – | – | – | 45% | – | 12% | ||||
| Morning Consult | May 1–31, 2023 | 300 (LV) | – | – | – | 17% | – | 5% | 0% | 8% | 5% | 1% | 60% | 4%[pt] | 0% |
| McLaughlin & Associates | May 23–25, 2023 | 400 (LV) | – | 0% | 1% | 24% | 1% | 4% | 1% | 5% | 2% | 7% | 50% | 3%[pu] | 4% |
| – | – | 36% | – | – | – | – | – | – | 54% | – | 11% | ||||
| Emerson College | May 19–22, 2023 | 600 (LV) | ± 3.9% | 0% | – | 20% | – | 5% | 1% | 5% | 2% | 3% | 62% | 2%[pv] | – |
| National Research[O] | May 9–11, 2023 | 500 (LV) | ± 4.4% | – | – | 26% | – | 6% | 1% | 4% | 3% | 1% | 44% | – | 11% |
| – | – | 33% | – | – | – | – | – | – | 45% | – | 22% | ||||
| McLaughlin & Associates[P] | Apr 27–30, 2023 | 500 (LV) | ± 4.4% | – | 1% | 20% | 1% | 5% | 0% | 7% | 2% | 1% | 54% | 5%[pw] | 5% |
| – | – | 22% | – | – | – | – | – | – | 57% | – | – | ||||
| Morning Consult | Apr 1–30, 2023 | 294 (LV) | – | – | – | 20% | – | 4% | 0% | 7% | 4% | 0% | 60% | 3%[px] | 2% |
| Victory Insights | Apr 10–13, 2023 | 400 (LV) | ± 4.8% | – | – | 24% | – | 14% | 4% | – | 3% | – | 54% | 1%[py] | – |
| – | – | 59% | – | 24% | 5% | – | 8% | – | – | 4%[pz] | – | ||||
| – | – | 41% | – | – | – | – | – | – | 59% | – | – | ||||
| Cygnal | Apr 3–4, 2023 | 600 (LV) | ± 3.9% | – | – | 30% | – | 5% | 1% | 2% | 2% | 1% | 37% | 3%[qa] | 19% |
| J.L. Partners | Mar 25 – April 4, 2023 | 628 (LV) | ± 3.9% | – | – | 26% | – | 5% | – | 3% | 1% | – | 41% | 10%[qb] | 14% |
| – | – | 39% | – | – | – | – | – | – | 47% | – | 15% | ||||
| Morning Consult | Mar 1–31, 2023 | 329 (LV) | – | – | – | 27% | – | 5% | – | 7% | – | 0% | 57% | 2%[qc] | 2% |
| Morning Consult | Feb 1–28, 2023 | 281 (LV) | – | – | – | 25% | – | 6% | – | 9% | 0% | 0% | 52% | 8%[qd] | 0% |
| Morning Consult | Jan 1–31, 2023 | 367 (LV) | – | – | – | 27% | – | 5% | – | 9% | – | 1% | 51% | 5%[qe] | 2% |
| Morning Consult | Dec 1–31, 2022 | 227 (LV) | – | – | – | 35% | – | 2% | – | 11% | – | 1% | 44% | 8%[qf] | 0% |
| WPA Intelligence[F] | Nov 11–13, 2022 | 508 (LV) | ± 4.4% | – | – | 48% | – | – | – | – | – | – | 37% | – | 16% |
| WPA Intelligence[F] | Aug 7–10, 2022 | 508 (LV) | ± 4.4% | – | – | 37% | – | – | – | – | – | – | 52% | – | 12% |
| Neighborhood Research and Media[R] | Jun 22 – July 1, 2022 | 546 (LV) | ± 4.2% | – | – | 17% | – | 2% | – | 2% | – | – | 38% | 4%[qg] | – |
| Victory Insights | Mar 5–8, 2021 | 630 (RV) | – | – | – | 4% | – | 6% | – | 8% | – | – | 61% | 13%[qh] | – |
| – | – | 20% | – | 10% | – | 19% | – | – | – | 33%[qi] | – |
Kansas caucus[edit]
| Poll source | Date(s) administered |
Sample size |
Ron DeSantis |
Nikki Haley |
Mike Pence |
Donald Trump |
Other | Undecided |
|---|---|---|---|---|---|---|---|---|
| Remington Research | Feb 15–16, 2023 | 1,010 (LV) | 41% | – | – | 33% | – | 26% |
| 17% | 9% | 9% | 30% | 9%[qj] | 19% | |||
| Echelon Insights | Aug 31 – Sep 7, 2022 | 192 (LV) | 37% | – | – | 52% | – | 11% |
Kentucky caucus[edit]
| Poll source | Date(s) administered |
Sample size |
Margin of error |
Chris Christie |
Ron DeSantis |
Nikki Haley |
Asa Hutchinson |
Mike Pence |
Vivek Ramaswamy |
Tim Scott |
Donald Trump |
Other | Undecided |
|---|---|---|---|---|---|---|---|---|---|---|---|---|---|
| Emerson College | May 10–12, 2023 | 500 (LV) | ± 4.3% | 2% | 14% | 3% | 0% | 4% | 3% | 1% | 70% | 3%[qk] | – |
| Emerson College | Apr 10–11, 2023 | 900 (LV) | ± 3.0% | – | 23% | 4% | 1% | 4% | – | 1% | 62% | 6%[ql] | – |
Louisiana primary[edit]
| Poll source | Date(s) administered |
Sample size |
Margin of error |
Chris Christie |
Ron DeSantis |
Mike Pence |
Vivek Ramaswamy |
Tim Scott |
Donald Trump |
Other | Undecided |
|---|---|---|---|---|---|---|---|---|---|---|---|
| Emerson College | Aug 13–14, 2023 | – | – | 1% | 10% | 2% | 1% | 1% | 75% | 0%[qm] | – |
| Echelon Insights | Aug 31 – Sep 7, 2022 | 242 (LV) | ± 6.5% | – | 29% | – | – | – | 65% | – | 6% |
Maine caucus[edit]
| Poll source | Date(s) administered |
Sample size[b] |
Margin of error |
Liz Cheney |
Ron DeSantis |
Nikki Haley |
Mike Pence |
Mike Pompeo |
Vivek Ramaswamy |
Chris Sununu |
Donald Trump |
|---|---|---|---|---|---|---|---|---|---|---|---|
| Digital Research Inc. | Mar 22 – April 22, 2023 | 192 (LV) | – | 10% | 27% | 3% | 5% | 1% | 1% | 1% | 59% |
Hypothetical polling
- Maine's 2nd congressional district
| Poll source | Date(s) administered |
Sample size[b] |
Margin of error |
Nikki Haley |
Mike Pence |
Other | Undecided | ||||
|---|---|---|---|---|---|---|---|---|---|---|---|
| Redrawing of congressional districts after the 2020 redistricting cycle | |||||||||||
| Inauguration of Joe Biden | |||||||||||
| 2020 presidential election | |||||||||||
| SurveyUSA | Jun 30 – July 6, 2020 | 604 (LV) | ± 4.1% | 12% | 30% | 36%[qn] | 21% | ||||
Maryland primary[edit]
| Poll source | Date(s) administered |
Sample size |
Margin of error |
Ron DeSantis |
Nikki Haley |
Larry Hogan |
Mike Pence |
Tim Scott |
Donald Trump |
Other | Undecided |
|---|---|---|---|---|---|---|---|---|---|---|---|
| OpinionWorks | April 7–10, 2024 | 451 (LV) | ± 4.6% | – | 18% | – | – | – | 74% | - | 7% |
| Gonzales Research | May 30 – Jun 6, 2023 | 221 (LV) | ± 3.5% | 37% | - | - | - | - | 42% | - | 21% |
| co/efficient | Feb 19–20, 2023 | 1,007 (LV) | ± 3.58% | 27% | 6% | 18% | 1% | 1% | 33% | 2%[qo] | 12% |
| – | – | 32% | – | – | 59% | – | 10% | ||||
| 39% | – | – | – | – | 35% | – | 26% | ||||
| OpinionWorks | May 27 – Jun 2, 2022 | 428 (LV) | ± 4.7% | 12% | 5% | 25% | 6% | – | 48% | – | – |
Massachusetts primary[edit]
| Source of poll aggregation |
Dates administered |
Dates updated |
Nikki Haley |
Donald Trump |
Other/ Undecided[qp] |
Margin |
|---|---|---|---|---|---|---|
| February 7–8, 2024 | February 15, 2024 | 29.3% | 63.0% | 7.7% | Trump +33.7 | |
| FiveThirtyEight | through February 6, 2024 | March 5, 2024 | 29.3% | 66.6% | 4.1% | Trump +37.3 |
| Poll source | Date(s) administered |
Sample size[qq] |
Margin of error |
Ron DeSantis |
Nikki Haley |
Mike Pence |
Tim Scott |
Donald Trump |
Other | Undecided |
|---|---|---|---|---|---|---|---|---|---|---|
| YouGov[S] | Oct 13–20, 2023 | 107 (V) | ± 5.1% | 15% | 12% | 3% | 6% | 54% | 10%[qr] | – |
| UMass-Amherst | Mar 28 – Apr 5, 2023 | 154 (RV) | – | 18% | 4% | 10% | 1% | 59% | 8%[qs] | – |
| 32% | – | – | – | 68% | – | – | ||||
| Opinion Diagnostics | Mar 31 – Apr 1, 2023 | 475 (LV) | ± 4.5% | 21% | 9% | 3% | – | 45% | 3% | 19% |
| 32% | – | – | – | 46% | – | 22% | ||||
| UMass-Amherst | Jun 15–21, 2022 | 237 (RV) | – | 24% | 6% | 6% | 1% | 51% | 11%[qt] | – |
Michigan primary[edit]
| Source of poll aggregation |
Dates administered |
Dates updated |
Nikki Haley |
Donald Trump |
Other/ Undecided[qu] |
Margin |
|---|---|---|---|---|---|---|
| FiveThirtyEight | through February 24, 2024 | February 27, 2024 | 21.8% | 78.7% | - | Trump +56.9 |
| Poll source | Date(s) administered |
Sample size[b] |
Margin of error |
Doug Burgum |
Chris Christie |
Ron DeSantis |
Nikki Haley |
Will Hurd |
Asa Hutchinson |
Perry Johnson |
Mike Pence |
Vivek Ramaswamy |
Tim Scott |
Donald Trump |
Other | Undecided |
|---|---|---|---|---|---|---|---|---|---|---|---|---|---|---|---|---|
| Emerson College/The Hill | Feb 20–24, 2024 | 486 (LV) | ±3% | – | – | – | 20.3% | – | – | – | – | – | – | 69.2% | – | 10.5% |
| Michigan Information and Research Service (MIRS) | Jan 4–10, 2024 | 600 (LV) | ±4% | 3% | 8% | 9% | 19% | – | – | – | – | 2% | – | 53% | – | 6% |
| CNN/SSRS | Nov 30 – December 7, 2023 | 618 (LV) | ± 3.4% | 1% | 6% | 15% | 13% | – | 1% | – | – | 4% | – | 58% | 1% | 3% |
| Morning Consult | Nov 1–30, 2023 | 1,348 (LV) | – | 0% | 3% | 13% | 10% | – | 0% | – | – | 8% | 1% | 65% | – | – |
| Morning Consult | Oct 1–31, 2023 | 1,342 (LV) | – | 1% | 3% | 10% | 6% | 0% | 0% | – | 7% | 9% | 1% | 63% | – | – |
| Public Policy Polling (D) | Oct 9–10, 2023 | 430 (LV) | ± 4.7% | 2% | 3% | 13% | 6% | – | 0% | – | 2% | 3% | 0% | 63% | – | 8% |
| Morning Consult | Sep 1–30, 2023 | 1,238 (LV) | – | 0% | 4% | 12% | 6% | 0% | 0% | – | 7% | 10% | 1% | 58% | – | 2% |
| Susquehanna University | Sep 7–12, 2023 | 219 (LV) | – | 0% | 0% | 18% | 3% | – | 0% | – | 5% | 5% | 0% | 65% | – | – |
| Morning Consult | Aug 1–31, 2023 | 1,299 (LV) | – | 0% | 4% | 15% | 3% | 0% | 1% | – | 8% | 8% | 2% | 59% | 0%[qv] | – |
| Emerson College | Aug 1–2, 2023 | 498 (RV) | ± 4.3% | 1% | 2% | 13% | 3% | 0% | 1% | 0% | 7% | 4% | 2% | 61% | 1% | 6% |
| Morning Consult | July 1–31, 2023 | 1,350 (LV) | – | – | 3% | 18% | 3% | 0% | 1% | – | 10% | 7% | 2% | 55% | – | 1% |
| Mitchell Research[T] | Jul 11–13, 2023 | 639 (LV) | ± 4.0% | – | – | 13% | 1% | – | – | 0% | 3% | – | 2% | 69% | – | 11% |
| Morning Consult | June 1–30, 2023 | 1,242 (LV) | – | 1% | 2% | 25% | 3% | 0% | 2% | – | 9% | 3% | 3% | 52% | 1%[qw] | – |
| Morning Consult | May 1–31, 2023 | 1,354 (LV) | – | – | – | 25% | 2% | – | 1% | – | 9% | 5% | 1% | 53% | 5%[qx] | 1% |
| Morning Consult | Apr 1–30, 2023 | 1,356 (LV) | – | – | – | 26% | 3% | – | 0% | – | 10% | 2% | 1% | 53% | 5%[qy] | – |
| Morning Consult | Mar 1–31, 2023 | 1,378 (LV) | – | – | – | 30% | 3% | – | – | – | 10% | 0% | 1% | 51% | 5%[qz] | – |
| Morning Consult | Feb 1–28, 2023 | 1,232 (LV) | – | – | – | 32% | 4% | – | – | – | 10% | 0% | 1% | 46% | 6%[ra] | 1% |
| Echelon Insights | Feb 13–16, 2023 | 400 (V) | ± 6.0% | – | – | 47% | – | – | – | – | – | – | – | 42% | 11% | – |
| Morning Consult | Jan 1–31, 2023 | 1,709 (LV) | – | – | – | 33% | 1% | – | – | – | 10% | – | 0% | 48% | 5%[rb] | 3% |
| Morning Consult | Dec 1–31, 2022 | 909 (LV) | – | – | – | 32% | 1% | – | – | – | 10% | – | 0% | 50% | 7%[rc] | – |
| Glengariff Group | Jul 13–15, 2022 | 500 (LV) | ± 4.4% | – | – | 42% | – | – | – | – | – | – | – | 45% | 13% | – |
Mississippi primary[edit]
| Poll source | Date(s) administered |
Sample size |
Margin of error |
Chris Christie |
Ron DeSantis |
Nikki Haley |
Asa Hutchinson |
Mike Pence |
Vivek Ramaswamy |
Tim Scott |
Donald Trump |
Other | Undecided |
|---|---|---|---|---|---|---|---|---|---|---|---|---|---|
| Mississippi Today/Siena College | Aug 20–28, 2023 | 650 (LV) | ± 4.0% | 6% | 22% | 3% | 2% | 2% | 2% | 2% | 61% | 2% | – |
| Mississippi Today/Siena College | Jan 8–12, 2023 | 487 (RV) | ± 5.9% | – | 39% | – | – | – | – | – | 46% | 3%[rd] | 11% |
| Echelon Insights | Aug 31 – Sep 7, 2022 | 211 (LV) | ± 7.8% | – | 31% | – | – | – | – | – | 58% | 11% | – |
Missouri primary[edit]
| Poll source | Date(s) administered |
Sample size[b] |
Margin of error |
Ron DeSantis |
Nikki Haley |
Mike Pence |
Donald Trump |
Other | Undecided | |||||
|---|---|---|---|---|---|---|---|---|---|---|---|---|---|---|
| Remington Research | Feb 8–9, 2023 | 820 (LV) | – | 35% | 8% | – | 38% | – | – | |||||
| 45% | – | – | 38% | – | – | |||||||||
| Remington Research | Nov 15–16, 2022 | 940 (LV) | ± 3.0% | 47% | – | – | 38% | – | 15% | |||||
| 38% | – | – | 36% | 7%[re] | 19% | |||||||||
| Remington Research | Jul 27–28, 2022 | 818 (LV) | ± 3.4% | 18% | – | – | 42% | 23%[rf] | 17% | |||||
| Inauguration of Joe Biden | ||||||||||||||
| Remington Research | Dec 2–3, 2020 | 840 (RV) | ± 3.4% | – | – | 32% | – | 42%[rg] | 26% | |||||
Montana primary[edit]
| Poll source | Date(s) administered |
Sample size[b] |
Margin of error |
Chris Christie |
Ron DeSantis |
Nikki Haley |
Mike Pence |
Vivek Ramaswamy |
Tim Scott |
Donald Trump |
Other | Undecided |
|---|---|---|---|---|---|---|---|---|---|---|---|---|
| Fabrizio, Lee & Associates | Oct 23–25, 2023 | 600 (LV) | ± 4.0% | 2% | 12% | 7% | 3% | 3% | 1% | 64% | 2%[rh] | 6% |
| J.L. Partners | Aug 12–17, 2023 | 418 (LV) | ? | 3% | 15% | 3% | 2% | 6% | 3% | 52% | 3%[ri] | 12% |
| – | 29% | – | – | – | – | 56% | – | 15% | ||||
| Public Policy Polling (D) | Jun 19–20, 2023 | 510 (LV) | ± 4.3% | 4% | 23% | 5% | 5% | 3% | 2% | 46% | – | 12% |
| – | 37% | – | – | – | – | 49% | – | 14% | ||||
| Echelon Insights | Aug 31 – Sep 7, 2022 | 142 (LV) | ± 6.6% | – | 28% | – | – | – | – | 56% | – | 16% |
Nevada caucus[edit]
| Source of poll aggregation |
Dates administered |
Dates updated |
Donald Trump |
Other/ Undecided[rj] |
Margin |
|---|---|---|---|---|---|
| RealClearPolling | September 29, 2023 – January 8, 2024 | January 21, 2024 | 69.0% | 31.0%[rk] | Trump +58.5 |
| Poll source | Date(s) administered |
Sample size[b] |
Margin of error |
Chris Christie |
Ron DeSantis |
Nikki Haley |
Asa Hutchinson |
Mike Pence |
Vivek Ramaswamy |
Tim Scott |
Donald Trump |
Other | Undecided |
|---|---|---|---|---|---|---|---|---|---|---|---|---|---|
| McLaughlin & Associates[U] | Dec 11–13, 2023 | 400 (LV) | ± 4.9% | 5% | 15% | – | – | – | 2% | – | 75% | 0%[rl] | 3% |
| SSRS/CNN | Sep 29 – October 6, 2023 | 650 (LV) | ± 5.3% | 2% | 13% | 6% | – | 3% | 4% | 2% | 65% | 4%[rm] | 2% |
| National Research[V] | Jun 26–28, 2023 | 500 (LV) | ± 4.4% | 3% | 22% | 3% | 0% | 2% | 2% | 2% | 52% | – | 14%[rn] |
| National Research[V] | May 30 – June 1, 2023 | 500 (LV) | ± 4.4% | – | 21% | 3% | 0% | 1% | 2% | 2% | 53% | 0%[ro] | 17% |
| Vote TXT | May 15–19, 2023 | 112 (RV) | ± 4.8% | – | 21% | 5% | – | 2% | 3% | – | 51% | 7% | 11% |
| Susquehanna Polling & Research | Oct 24–27, 2022 | 500 (LV) | ± 4.3% | – | 34% | 1% | – | 7% | – | – | 41% | 7%[rp] | 10% |
New Hampshire primary[edit]

- Aggregate polls
| Source of poll aggregation |
Dates administered |
Dates updated |
Nikki Haley |
Donald Trump |
Other/ Undecided[rq] |
Margin |
|---|---|---|---|---|---|---|
| 270 to Win | January 22–23, 2024 | January 23, 2024 | 35.7% | 56.5% | 7.8%[rr] | Trump +20.8 |
| FiveThirtyEight | Through January 22, 2024 | January 23, 2024 | 36.3% | 53.9% | 9.8% | Trump +17.6 |
| RealClearPolling | January 16–22, 2024 | January 23, 2024 | 36.5% | 55.8% | 7.7% | Trump +19.3 |
| Average | 36.2% | 55.4% | 8.4% | Trump +19.2 | ||
| Poll source | Date(s) administered |
Sample size[b] |
Margin of error |
Doug Burgum |
Chris Christie |
Ron DeSantis |
Nikki Haley |
Asa Hutchinson |
Mike Pence |
Vivek Ramaswamy |
Tim Scott |
Donald Trump |
Other | Undecided |
|---|---|---|---|---|---|---|---|---|---|---|---|---|---|---|
| Suffolk University/Boston Globe/WBTS | Jan 21–22, 2024 | 500 (LV) | ± 4.4% | – | – | – | 38% | – | – | – | – | 60% | 1% | 1% |
| Insider Advantage | January 21, 2024 | 850 (LV) | ±4.32% | – | – | – | 35% | – | – | – | – | 62% | – | 3% |
| Suffolk University/Boston Globe/WBTS | Jan 20–21, 2024 | 500 (LV) | ± 4.4% | – | – | – | 38% | – | – | – | – | 57% | 2% | 2% |
| Suffolk University/Boston Globe/WBTS | Jan 19–20, 2024 | 500 (LV) | ± 4.4% | – | – | 6% | 36% | – | – | – | – | 55% | 0.6% | 2.4% |
| American Research Group | Jan 18–20, 2024 | 600 (LV) | ±4.0% | – | – | 6% | 44% | – | – | – | – | 46% | – | – |
| Emerson College/WHDH | Jan 18–20, 2024 | 673 (RV) | ±3.7% | – | – | 8% | 35% | 50% | 7% | |||||
| Suffolk University/Boston Globe/WBTS | Jan 17–18, 2024 | 500 (LV) | ± 4.4% | – | – | 6% | 35% | – | – | – | – | 52% | – | 4% |
| Suffolk University/Boston Globe/WBTS | Jan 16–17, 2024 | 500 (LV) | ± 4.4% | – | – | 6% | 36% | – | – | – | – | 50% | 1% | 4% |
| Saint Anselm College | January 16, 2024 | 1,398 (LV) | ± 2.6% | – | – | 6% | 38% | – | – | – | – | 52% | – | 4% |
| Suffolk University/Boston Globe/WBTS | Jan 15–16, 2024 | 500 (LV) | ± 4.4% | – | – | 5% | 34% | – | – | – | – | 50% | – | 11% |
| American Research Group | Jan 12–15, 2024 | 600 (LV) | ± 4.0% | – | – | 4% | 40% | 1% | – | 4% | – | 40% | 2% | 9% |
| Saint Anselm College | Jan 8–9, 2024 | 1,194 (LV) | ± 2.8% | – | 9% | 6% | 31% | – | – | 6% | – | 45% | – | 3% |
| University of New Hampshire Survey/CNN | Jan 4–8, 2024 | 919 (LV) | ± 3.2% | – | 12% | 5% | 32% | 0% | – | 8% | – | 39% | 0% | 5% |
| American Research Group | December 27, 2023 – January 4, 2024 | 600 (LV) | ± 4.0% | – | 10% | 5% | 33% | 1% | – | 4% | – | 37% | 1% | 9% |
| American Research Group | Dec 14–20, 2023 | 600 (LV) | ± 4.0% | – | 13% | 6% | 29% | 1% | – | 5% | – | 33% | 1% | 12% |
| Saint Anselm College | Dec 18–19, 2023 | 1,072 (LV) | ± 3.0% | – | 12% | 6% | 30% | 0% | – | 5% | – | 44% | – | 3% |
| University of Massachusetts Lowell/YouGov | Dec 7–18, 2023 | 450 (LV) | ± 5.4% | – | 6% | 10% | 22% | 1% | – | 4% | – | 52% | 0%[rs] | 5% |
| CBS News/YouGov | Dec 8–15, 2023 | 855 (LV) | ± 4.1% | – | 10% | 11% | 29% | 1% | – | 5% | – | 44% | – | – |
| Trafalgar Group | Dec 9–11, 2023 | 1,098 (LV) | ± 2.9% | – | 14% | 11% | 18% | 0% | – | 10% | – | 45% | – | 1% |
| Americans for Prosperity | Nov 19–21, 2023 | 800 (LV) | – | – | – | 9% | 25% | – | – | – | – | 40% | 26% | – |
| University of New Hampshire Survey Center/CNN | Nov 10–14, 2023 | 994 (LV) | ± 3.1% | 2% | 14% | 9% | 20% | 0% | – | 8% | – | 42% | 3% | 2% |
| Washington Post/Monmouth University | Nov 9–14, 2023 | 606 (LV) | ± 4.5% | 2% | 11% | 7% | 18% | 1% | – | 8% | 3% | 46% | 0% | 4% |
| Emerson College/WHDH | Nov 10–13, 2023 | 465 (RV) | ± 3.3% | 1.5% | 8.8% | 7.2% | 17.6% | 0.3% | – | 4.6% | 2.2% | 48.5% | – | 9.3% |
| USA TODAY/Boston Globe/Suffolk University | Sep 28 – October 2, 2023 | 500 (LV) | ± 4.4% | 1% | 6% | 10% | 19% | – | 1% | 4% | 4% | 49% | – | – |
| CBS News/YouGov | Sep 15–24, 2023 | 502 (LV) | ± 5.4% | 2% | 8% | 13% | 11% | 1% | 2% | 8% | 5% | 50% | 0%[rt] | – |
| Saint Anselm College | Sep 19–20, 2023 | 931 (LV) | ± 3.2% | 1% | 10% | 11% | 15% | 1% | 1% | 6% | 3% | 45% | 0%[ru] | 6% |
| Insider Advantage | September 20, 2023 | 850 (LV) | ± 3.36% | 4% | 10% | 8% | 14% | 1% | 1% | 5% | 5% | 42% | 1%[rv] | 9% |
| University of New Hampshire | Sep 14–18, 2023 | 1,006 (LV) | ± 3.4% | 1% | 11% | 10% | 12% | 0% | 2% | 13% | 6% | 39% | 1%[rw] | 6% |
| NMB Research | Aug 25–31, 2023 | 800 (LV) | – | 1% | 8% | 10% | 10% | 1% | 4% | 8% | 5% | 47% | <3%[rx] | 4% |
| Fabrizio, Lee & Associates | Aug 25–28, 2023 | 500 (LV) | – | 2% | 5% | 11% | 9% | <1% | 1% | 9% | 5% | 48% | <3%[ry] | 9% |
| Echelon Insights[W] | Aug 15–17, 2023 | 800 (LV) | ± 4.0% | 2% | 14% | 9% | 3% | 1% | 3% | 11% | 7% | 34% | 3%[rz] | 12% |
| Emerson College | Aug 9–11, 2023 | 498 (RV) | ± 4.9% | 4% | 9% | 8% | 4% | – | 1% | 3% | 6% | 49% | 3%[sa] | 13% |
| co/efficient | Aug 5–7, 2023 | 862 (LV) | ± 3.3% | 4% | 9% | 9% | 7% | 1% | 3% | 5% | 5% | 43% | 3%[sb] | 13% |
| Manhattan Institute | July 2023 | 603 (LV) | – | 3% | 11% | 13% | 7% | 1% | 4% | 8% | 7% | 34% | 3%[sc] | 8% |
| National Research[X] | Jul 25–26, 2023 | 500 (LV) | ± 4.4% | 5% | 8% | 11% | 3% | 1% | 2% | 6% | 8% | 41% | – | 15% |
| University of New Hampshire | Jul 13–17, 2023 | 898 (LV) | ± 3.3% | 6% | 6% | 23% | 5% | 0% | 1% | 5% | 8% | 37% | 1%[sd] | 8% |
| National Research[X] | Jul 10–12, 2023 | 500 (LV) | ± 4.4% | 3% | 7% | 15% | 5% | 1% | 1% | 4% | 6% | 39% | – | 17% |
| American Pulse | Jul 5–11, 2023 | 895 | ± 3.2% | 3% | 10% | 11% | 3% | – | 5% | 5% | 7% | 48% | – | 8%[se] |
| Saint Anselm College | Jun 21–23, 2023 | 494 (LV) | ± 4.4% | 2% | 6% | 19% | 5% | 2% | 2% | 2% | 4% | 47% | 0%[sf] | 10% |
| New Hampshire Journal/co-efficient | Jun 14–16, 2023 | 904 (LV) | ± 3.3% | – | 9% | 13% | 3% | – | 5% | 3% | 3% | 47% | 5% | 10% |
| – | – | 23% | – | – | – | – | – | 49% | – | 28% | ||||
| National Research[X] | Jun 12–14, 2023 | 500 (LV) | ± 4.4% | – | 7% | 12% | 5% | 2% | 3% | 3% | 7% | 44% | 18%[sg] | – |
| National Research[X] | May 15–17, 2023 | 500 (LV) | ± 4.4% | – | – | 18% | 3% | 1% | 1% | 6% | 1% | 39% | 32%[sh] | – |
| University of New Hampshire | Apr 13–17, 2023 | 818 (LV) | ± 3.4% | – | 1% | 22% | 3% | 0% | 3% | 3% | 2% | 42% | 20%[si] | 4% |
| J.L Partners | Apr 2–11, 2023 | 623 (LV) | ± 3.9% | – | 2% | 18% | 4% | – | 2% | 1% | 1% | 51% | 19%[sj] | 6% |
| – | – | 33% | – | – | – | – | – | 53% | – | 13% | ||||
| Saint Anselm College | Mar 28–30, 2023 | 1,320 (RV) | ± 4.0% | – | 1% | 29% | 4% | – | 1% | 3% | 1% | 42% | 19%[sk] | – |
| Emerson College | Mar 3–5, 2023 | 384 (RV) | ± 5.0% | – | – | 17% | 6% | – | 4% | – | 1% | 58% | 14%[sl] | – |
| co/efficient | Jan 25–26, 2023 | 506 (LV) | ± 4.35% | – | – | – | – | – | – | – | – | 43% | 42% | 15% |
| – | – | 26% | 4% | – | 3% | – | – | 37% | 13%[sm] | 18% | ||||
| University of New Hampshire | Jan 19–23, 2023 | 349 (LV) | ± 5.2% | – | – | 42% | 8% | – | 1% | – | 0% | 30% | 16%[sn] | 3% |
| Neighborhood Research and Media | Dec 5–13, 2022 | 434 (LV) | ± 4.7% | – | – | 33% | – | – | 3% | – | – | 32% | 13% | 19% |
| WPA Intelligence[F] | Nov 11–13, 2022 | 401 (LV) | ± 4.9% | – | – | 52% | – | – | – | – | – | 37% | – | 11% |
| 2022 midterm elections | ||||||||||||||
| Saint Anselm College | Aug 9–11, 2022 | 820 (RV) | ± 3.4% | – | – | 29% | 3% | – | 3% | – | 1% | 50% | 4%[so] | 8% |
| WPA Intelligence[F] | Aug 7–10, 2022 | 401 (LV) | ± 4.9% | – | – | 45% | – | – | – | – | – | 45% | – | 10% |
| Neighborhood Research and Media[Y] | Jul 5–8, 2022 | 475 (RV) | ± 4.5% | – | – | 22% | 1% | – | 1% | – | – | 41% | 3%[sp] | 32% |
| University of New Hampshire | Jun 16–20, 2022 | 318 (LV) | ± 5.5% | – | – | 39% | 6% | – | 9% | – | 0% | 37% | 6%[sq] | 3% |
| University of New Hampshire | Oct 14–18, 2021 | 441 (LV) | ± 4.7% | – | – | 18% | 6% | – | 4% | – | – | 43% | 14%[sr] | 10% |
| University of New Hampshire | Jul 15–19, 2021 | 770 (LV) | ± 3.5% | – | – | 19% | 6% | – | 5% | – | – | 43% | 13%[ss] | 10% |
| Saint Anselm College[Z] | May 7–10, 2021 | 635 (RV) | ± 3.9% | – | – | 20% | 7% | – | 4% | – | 0% | 52% | 7%[st] | 10% |
| Victory Insights | Mar 5–11, 2021 | 400 (RV) | – | – | – | 5% | 3% | – | 6% | – | – | 52% | 14%[su] | – |
| – | – | 21% | 7% | – | 18% | – | – | – | 29%[sv] | – | ||||
| Inauguration of Joe Biden | ||||||||||||||
| Praecones Analytica | Nov 30 – December 2, 2020 | 624 (RV) | ± 4.0% | – | – | – | 7% | – | 6% | – | 2% | 57% | 19%[sw] | 10% |
| – | – | – | 12% | – | 25% | – | 3% | – | 46%[sx] | 14% | ||||
New York primary[edit]
| Poll source | Date(s) administered |
Sample size[b] |
Margin of error |
Chris Christie |
Ron DeSantis |
Nikki Haley |
Asa Hutchinson |
Mike Pence |
Vivek Ramaswamy |
Tim Scott |
Donald Trump |
Others | Undecided |
|---|---|---|---|---|---|---|---|---|---|---|---|---|---|
| Morning Consult | Nov 1–30, 2023 | 1,876 (LV) | – | 4% | 13% | 8% | 0% | – | 5% | 2% | 66% | 1%[sy] | 1% |
| Morning Consult | Oct 1–31, 2023 | 2,014 (LV) | – | 4% | 12% | 6% | 0% | 4% | 7% | 3% | 64% | 0%[sz] | – |
| Morning Consult | Sep 1–30, 2023 | 1,924 (LV) | – | 3% | 14% | 5% | 1% | 5% | 8% | 2% | 62% | 1%[ta] | – |
| Siena College | Sep 10–13, 2023 | 804 (RV) | ± 4.3% | – | – | – | – | – | – | – | 64% | 27% | 8% |
| Morning Consult | Aug 1–31, 2023 | 2,006 (LV) | – | 4% | 14% | 4% | 0% | 7% | 10% | 2% | 57% | 0%[tb] | 2% |
| Siena College | Aug 13–16, 2023 | 803 (RV) | ± 4.4% | – | – | – | – | – | – | – | 63% | 32% | 5% |
| Morning Consult | July 1–31, 2023 | 1,886 (LV) | – | 4% | 18% | 2% | 0% | 6% | 8% | 2% | 58% | 1%[tc] | 1% |
| Morning Consult | June 1–30, 2023 | 1,856(LV) | – | 3% | 17% | 3% | 1% | 6% | 4% | 4% | 60% | 1%[td] | 1% |
| Siena College | Jun 20–25, 2023 | 817 (RV) | ± 3.9% | – | – | – | – | – | – | – | 61% | 34% | 5% |
| Morning Consult | May 1–31, 2023 | 1,932(LV) | – | – | 17% | 3% | 1% | 6% | 4% | 4% | 63% | 3%[te] | – |
| Siena College | May 7–11, 2023 | 810 (RV) | ± 4.1% | – | – | – | – | – | – | – | 60% | 32% | 8% |
| Morning Consult | Apr 1–30, 2023 | 1,792(LV) | – | – | 20% | 3% | 0% | 6% | 1% | 3% | 59% | 7%[tf] | 1% |
| Morning Consult | Mar 1–31, 2023 | 1,831(LV) | – | – | 28% | 4% | – | 6% | 0% | 4% | 51% | 6%[tg] | 1% |
| Siena College | Mar 19–22, 2023 | 802 (RV) | ± 4.6% | – | 27% | – | – | – | – | – | 52% | 18% | – |
| Morning Consult | Feb 1–28, 2023 | 1,410(LV) | – | – | 28% | 4% | – | 8% | 0% | 2% | 51% | 6%[th] | 1% |
| Echelon Insights | Feb 21–23, 2023 | 600 (LV) | ± 4.2% | – | 45% | – | – | – | – | – | 44% | – | 13% |
| Morning Consult | Jan 1–31, 2023 | 1,871(LV) | – | – | 34% | 3% | – | 9% | – | 1% | 46% | 9%[ti] | – |
| Morning Consult | Dec 1–31, 2022 | 1,074 (LV) | – | – | 33% | 3% | – | 7% | – | 3% | 44% | 9%[tj] | 1% |
North Carolina primary[edit]
| Source of poll aggregation |
Dates administered |
Dates updated |
Nikki Haley |
Donald Trump |
Other/ Undecided[tk] |
Margin |
|---|---|---|---|---|---|---|
| 270ToWin | February 5–7, 2024 | February 15, 2024 | 21.5% | 74.5% | 4.0% | Trump +53.0 |
| FiveThirtyEight | through February 4, 2024 | February 15, 2024 | 22.1% | 74.7% | 4.2% | Trump +52.6 |
| Poll source | Date(s) administered |
Sample size[b] |
Margin of error |
Chris Christie |
Ron DeSantis |
Nikki Haley |
Asa Hutchinson |
Mike Pence |
Vivek Ramaswamy |
Tim Scott |
Donald Trump |
Other | Undecided | |
|---|---|---|---|---|---|---|---|---|---|---|---|---|---|---|
| Capen Analytics | Feb 21, 2024 | 12,580 (LV) | ± 5.0% | – | – | 36% | – | – | – | – | 64% | – | – | |
| Public Policy Polling (D) | Jan 5–6, 2024 | 619 (LV) | ± 3.9% | 3% | 9% | 12% | 0% | – | 4% | – | 66% | 0%[tl] | 5% | |
| ECU Center for Survey Research | Nov 29 – Dec 1, 2023 | 445 (LV) | ± 5.4% | 2% | 10% | 13% | 1% | – | 3% | – | 63% | – | 8% | |
| Morning Consult | Nov 1–30, 2023 | 1,342 (LV) | – | 4% | 14% | 9% | 1% | – | 5% | 1% | 67% | 0%[tm] | – | |
| Meredith College | Nov 1–5, 2023 | 335 (LV) | ± 3.5% | 6% | 14% | 9% | 0% | - | 8% | 3% | 51% | 2%[tn] | 6% | |
| Morning Consult | Oct 1–31, 2023 | 1,337 (LV) | – | 3% | 14% | 8% | 0% | 4% | 6% | 2% | 61% | 0%[to] | 2% | |
| Morning Consult | Sep 1–30, 2023 | 1,366 (LV) | – | 3% | 15% | 8% | 0% | 5% | 7% | 2% | 58% | 0%[tp] | 2% | |
| Meredith College | Sep 16–19, 2023 | 350 (RV) | ± 3.5% | 3% | 13% | 6% | 0% | 5% | 8% | 3% | 51% | 6%[tq] | 7% | |
| Morning Consult | Aug 1–31, 2023 | 1,491 (LV) | – | 3% | 15% | 6% | 1% | 5% | 10% | 2% | 57% | 0%[tr] | 1% | |
| Morning Consult | July 1–31, 2023 | 1,535 (LV) | – | 3% | 15% | 5% | 0% | 6% | 9% | 3% | 58% | 0%[ts] | 1% | |
| Morning Consult | June 1–30, 2023 | 1,454 (LV) | – | 2% | 20% | 5% | 1% | 7% | 4% | 3% | 56% | 1%[tt] | 1% | |
| Opinion Diagnostics | Jun 5–7, 2023 | 408 (LV) | ± 4.8% | 2% | 22% | 7% | 1% | 6% | 1% | 4% | 44% | 2%[tu] | 11% | |
| – | 34% | – | – | – | – | – | 50% | – | 15% | |||||
| Morning Consult | May 1–31, 2023 | 1,453 (LV) | – | – | 20% | 6% | 1% | 6% | 3% | 2% | 59% | 3%[tv] | 1% | |
| Morning Consult | Apr 1–30, 2023 | 1,299 (LV) | – | – | 23% | 6% | 0% | 5% | 1% | 1% | 58% | 4%[tw] | 2% | |
| SurveyUSA[AA] | Apr 25–29, 2023 | 707 (LV) | ± 4.4% | – | 22% | 5% | 1% | 8% | 2% | 1% | 55% | 0%[tx] | 5% | |
| Morning Consult | Mar 1–31, 2023 | 1,31 (LV) | – | – | 27% | 9% | – | 8% | 0% | 1% | 51% | 2%[ty] | 2% | |
| Morning Consult | Feb 1–28, 2023 | 1,185 (LV) | – | – | 31% | 7% | – | 6% | – | 1% | 51% | 3%[tz] | 1% | |
| Morning Consult | Jan 1–31, 2023 | 1,703 (LV) | – | – | 30% | 4% | – | 7% | – | 1% | 52% | 5%[ua] | 1% | |
| Differentiators Data | Jan 9–12, 2023 | 213 (LV) | ± 4.5% | – | 47% | 4% | – | 2% | – | – | 35% | 3%[ub] | – | |
| Morning Consult | Dec 1–31, 2022 | 905 (LV) | – | – | 31% | 4% | – | 7% | – | 1% | 50% | 5%[uc] | 2% | |
| Differentiators Data | Dec 8–11, 2022 | 500 (LV) | ± 4.5% | – | 56% | – | – | – | – | – | 35% | – | – | |
| John Bolton Super PAC | Jul 22–24, 2022 | 149 (LV) | – | 1% | 27% | – | – | 6% | – | – | 37% | 12%[ud] | 16% | |
| Atlantic Polling Strategies[AB] | Apr 25–28, 2022 | 534 (LV) | ± 4.9% | – | 23% | 5% | – | 4% | – | 4% | 52% | 2%[ue] | 10% | |
| Spry Strategies | Apr 6–10, 2022 | 600 (LV) | ± 4.0% | – | 19% | 8% | – | 6% | – | 1% | 45% | 9%[uf] | 12% | |
| – | 32% | 8% | – | 9% | – | 2% | – | 18%[ug] | 31% | |||||
| Cygnal (R) | Apr 1–3, 2022 | 600 (LV) | ± 4.0% | – | 26% | 8% | – | 6% | – | – | 45% | 2%[uh] | 13% | |
| Cygnal (R) | Jan 7–9, 2022 | 600 (LV) | ± 4.0% | – | 19% | 8% | – | 5% | – | 2% | 47% | 3%[ui] | 16% | |
| Inauguration of Joe Biden | ||||||||||||||
| BUSR/UNLV Lee Business School | Nov 30 – Dec 2, 2020 | 221 (RV) | ± 7.0% | – | – | 6% | – | – | – | – | 76% | 13%[uj] | 6% | |
| – | – | 9% | – | 48% | – | – | – | 25%[uk] | 18% | |||||
Ohio primary[edit]
| Poll source | Date(s) administered |
Sample size |
Margin of error |
Chris Christie |
Ron DeSantis |
Nikki Haley |
Asa Hutchinson |
Mike Pence |
Vivek Ramaswamy |
Tim Scott |
Donald Trump |
Other | Undecided |
|---|---|---|---|---|---|---|---|---|---|---|---|---|---|
| McLaughlin & Associates (R) | Dec 12–14, 2023 | 600 (LV) | ± 4.0% | 6% | 11% | 15% | – | – | 3% | – | 61% | – | 4% |
| Morning Consult | Nov 1–30, 2023 | 1,881 (LV) | – | 3% | 11% | 8% | 0% | – | 6% | 1% | 69% | 0%[ul] | 2% |
| Emerson College/Nexstar, WJW (Cleveland) | Nov 10–13, 2023 | 468 (LV) | ± 4.5% | 2% | 8% | 10% | 1% | – | 6% | 1% | 62% | 1%[um] | 10% |
| Morning Consult | Oct 1–31, 2023 | 1,893(LV) | – | 2% | 13% | 7% | 0% | 5% | 8% | 2% | 62% | 0%[un] | 1% |
| Ohio Northern University | Oct 16–19, 2023 | 269 (LV) | ± 2.15% | 1% | 10% | 5% | 0%[uo] | 4% | 9% | – | 64% | 1%[up] | 6% |
| Morning Consult | Sep 1–30, 2023 | 1,621(LV) | – | 3% | 14% | 5% | 0% | 5% | 11% | 2% | 60% | 0%[un] | – |
| Morning Consult | Aug 1–31, 2023 | 1,803(LV) | – | 3% | 12% | 3% | 0% | 7% | 10% | 3% | 61% | 1%[uq] | – |
| Morning Consult | July 1–31, 2023 | 1,835(LV) | – | 3% | 16% | 2% | 0% | 8% | 9% | 3% | 58% | 0%[ur] | 1% |
| Ohio Northern University | Jul 17–26, 2023 | 675 (RV) | ± 3.7% | 2% | 9% | 3% | 1% | 6% | 12% | 5% | 64% | 1% | 3% |
| Suffolk University[dead link] | Jul 9–12, 2023 | 190 (RV) | – | 4% | 23% | 2% | 2% | 4% | 2% | 5% | 48% | 3%[us] | 8% |
| Morning Consult | June 1–30, 2023 | 1,711(LV) | – | 2% | 19% | 3% | 1% | 7% | 5% | 3% | 59% | 1%[ut] | 1% |
| East Carolina University | Jun 21–24, 2023 | 405 (RV) | ± 4.0% | 4% | 15% | 2% | 1% | 5% | 3% | – | 59% | 2% | 10% |
| Morning Consult | May 1–31, 2023 | 1,792(LV) | – | – | 20% | 3% | 0% | 7% | 5% | 2% | 60% | 3%[uu] | – |
| Morning Consult | Apr 1–30, 2023 | 1,754(LV) | – | – | 21% | 2% | 0% | 8% | 2% | 2% | 61% | 4%[uv] | – |
| Morning Consult | Mar 1–31, 2023 | 1,827(LV) | – | – | 27% | 4% | – | 7% | 0% | 1% | 56% | 3%[uw] | 2% |
| Morning Consult | Feb 1–28, 2023 | 1,573(LV) | – | – | 30% | 4% | – | 9% | 0% | 1% | 50% | 4%[ux] | 2% |
| Morning Consult | Jan 1–31, 2023 | 2,095(LV) | – | – | 31% | 2% | – | 9% | – | 1% | 50% | 5%[uy] | 2% |
| Morning Consult | Dec 1–31, 2022 | 1,188 (LV) | – | – | 33% | 2% | – | 8% | – | 1% | 48% | 5%[uz] | 3% |
| Echelon Insights | Aug 31 – Sep 7, 2022 | 377 (LV) | ± 4.3% | – | 30% | – | – | – | – | – | 58% | 12% | – |
| John Bolton Super PAC | Jul 22–24, 2022 | 136 (LV) | – | 2% | 30% | – | – | 9% | – | – | 28% | 16%[va] | 13% |
Oklahoma primary[edit]
| Poll source | Date(s) administered |
Sample size |
Margin of error |
Chris Christie |
Ron DeSantis |
Nikki Haley |
Asa Hutchinson |
Mike Pence |
Vivek Ramaswamy |
Tim Scott |
Donald Trump |
Other | Undecided |
|---|---|---|---|---|---|---|---|---|---|---|---|---|---|
| Morning Consult | Nov 1–30, 2023 | 637(LV) | – | 3% | 12% | 6% | 0% | – | 7% | 1% | 69% | 0%[vb] | 2% |
| Morning Consult | Oct 1–31, 2023 | 625(LV) | – | 5% | 7% | 4% | 0% | 7% | 6% | 1% | 68% | 0%[vc] | 2% |
| Morning Consult | Sep 1–30, 2023 | 566(LV) | – | 4% | 8% | 3% | 0% | 11% | 7% | 1% | 63% | 0%[vd] | 2% |
| Morning Consult | Aug 1–31, 2023 | 602(LV) | – | 3% | 11% | 3% | 0% | 6% | 10% | 2% | 63% | 1%[ve] | 1% |
| Morning Consult | July 1–31, 2023 | 629(LV) | – | 2% | 13% | 2% | 1% | 7% | 10% | 2% | 63% | 0%[vf] | – |
| Morning Consult | June 1–30, 2023 | 559(LV) | – | 3% | 14% | 3% | 0% | 7% | 4% | 2% | 66% | 1%[vg] | – |
| Morning Consult | May 1–31, 2023 | 627(LV) | – | – | 16% | 2% | 1% | 7% | 5% | 1% | 64% | 3%[vh] | 1% |
| Morning Consult | Apr 1–30, 2023 | 560(LV) | – | – | 14% | 2% | – | 8% | 2% | 2% | 67% | 4%[vi] | 1% |
| C.H.S. & Associates | Mar 27–31, 2023 | 300 (RV) | ± 4.3% | – | 29% | 6% | – | 6% | – | – | 38% | 9%[vj] | 11% |
| Morning Consult | Mar 1–31, 2023 | 615(LV) | – | – | 20% | 3% | – | 10% | 1% | 1% | 58% | 7%[vk] | – |
| Morning Consult | Feb 1–28, 2023 | 473(LV) | – | – | 24% | 3% | – | 8% | 1% | 0% | 58% | 7%[vl] | – |
| Morning Consult | Jan 1–31, 2023 | 697(LV) | – | – | 27% | 1% | – | 9% | – | 0% | 57% | 5%[vm] | 1% |
| Morning Consult | Dec 1–31, 2022 | 414 (LV) | – | – | 29% | 2% | – | 8% | – | – | 55% | 7%[vn] | – |
| Echelon Insights | Aug 31 – Sep 7, 2022 | 265 (LV) | – | – | 30% | – | – | – | – | – | 60% | – | 10% |
| Amber Integrated | Aug 11–15, 2022 | 684 (LV) | – | 2% | 22% | 2% | – | 6% | – | 1% | 50% | 11%[vo] | 7% |
| – | 2% | 49% | 5% | – | 10% | – | 1% | – | 27%[vp] | 9% |
Pennsylvania primary[edit]
| Poll source | Date(s) administered |
Sample size[b] |
Margin of error |
Chris Christie |
Ron DeSantis |
Nikki Haley |
Asa Hutchinson |
Mike Pence |
Vivek Ramaswamy |
Tim Scott |
Donald Trump |
Other | Undecided |
|---|---|---|---|---|---|---|---|---|---|---|---|---|---|
| Quinnipiac University | Jan 4–8, 2024 | 651 (RV) | ± 3.8% | 6% | 10% | 14% | – | – | 4% | – | 61% | 2%[vq] | 3% |
| Morning Consult | Nov 1–30, 2023 | 2,056 (LV) | – | 4% | 14% | 9% | 0% | – | 6% | 1% | 63% | 0%[vr] | 3% |
| Morning Consult | Oct 1–31, 2023 | 2,009 (LV) | – | 4% | 15% | 7% | 0% | 6% | 7% | 1% | 59% | 0%[vs] | 1% |
| Franklin & Marshall College | Oct 11–22, 2023 | 359 (RV) | ± 6.4% | 4% | 14% | 9% | 0% | 2% | 5% | 3% | 55% | 2%[vt] | 7% |
| Quinnipiac University | Sep 28 – Oct 2, 2023 | 711 (RV) | ± 3.7% | 4% | 14% | 8% | 0% | 4% | 2% | 1% | 61% | 3%[vu] | 3% |
| Morning Consult | Sep 1–30, 2023 | 1,910 (LV) | – | 3% | 14% | 6% | 0% | 8% | 8% | 1% | 58% | 0%[vv] | 2% |
| Morning Consult | Aug 1–31, 2023 | 1,979 (LV) | – | 4% | 15% | 3% | 0% | 8% | 8% | 2% | 58% | 0%[vw] | 2% |
| Franklin & Marshall College | Aug 9–20, 2023 | 297 (RV) | ± 7.0% | 3% | 21% | 5% | 1% | 6% | 9% | 6% | 39% | 5%[vx] | 8% |
| Morning Consult | July 1–31, 2023 | 2,139 (LV) | – | 4% | 20% | 3% | 0% | 7% | 7% | 3% | 55% | 1%[vy] | – |
| Morning Consult | June 1–30, 2023 | 2,136 (LV) | – | 3% | 23% | 3% | 1% | 9% | 3% | 3% | 54% | 1%[vz] | – |
| Quinnipiac University | Jun 22–26, 2023 | 614 (RV) | ± 4.0% | 5% | 25% | 4% | – | 5% | 1% | 4% | 49% | – | 6% |
| Morning Consult | May 1–31, 2023 | 2,062 (LV) | – | – | 22% | 4% | 0% | 7% | 3% | 2% | 58% | 4%[wa] | – |
| Morning Consult | Apr 1–30, 2023 | 2,058 (LV) | – | – | 25% | 3% | 0% | 9% | 2% | 2% | 53% | 6%[wb] | – |
| Franklin & Marshall College | Mar 27 – Apr 7, 2023 | 227 (RV) | ± 4.9% | – | 34% | 4% | – | 6% | – | 0% | 40% | 6%[wc] | 11% |
| Morning Consult | Mar 1–31, 2023 | 2,103 (LV) | – | – | 30% | 4% | – | 8% | 0% | 1% | 51% | 4%[wd] | 2% |
| Public Policy Polling | Mar 9–10, 2023 | 616 (LV) | – | – | 31% | 5% | – | 5% | – | – | 49% | – | 10% |
| – | 40% | – | – | – | – | – | 48% | – | 13% | ||||
| Morning Consult | Feb 1–28, 2023 | 1,769 (LV) | – | – | 32% | 4% | – | 8% | 0% | 1% | 46% | 8%[we] | 1% |
| Susquehanna Polling & Research | Feb 19–26, 2023 | 320 (RV) | ± 3.2% | – | 37% | 4% | – | 2% | – | 1% | 32% | 27%[wf] | – |
| Morning Consult | Jan 1–31, 2023 | 2,470 (LV) | – | – | 35% | 2% | – | 10% | – | 1% | 43% | 9%[wg] | – |
| Morning Consult | Dec 1–31, 2022 | 1,381 (LV) | – | – | 34% | 2% | – | 10% | – | 1% | 44% | 8%[wh] | 1% |
| Communication Concepts | Nov 19–21, 2022 | 639 (RV) | ± 3.9% | – | 45% | – | – | – | – | – | 40% | 4% | 12% |
| Echelon Insights | Aug 31 – Sep 7, 2022 | 353 (LV) | – | – | 40% | – | – | – | – | – | 48% | 12% | – |
| John Bolton Super PAC | Jul 22–24, 2022 | 129 (LV) | – | 2% | 29% | – | – | 7% | – | – | 40% | 10%[wi] | – |
Rhode Island primary[edit]
| Poll source | Date(s) administered |
Sample size[b] |
Margin of error |
Ron DeSantis |
Donald Trump |
Other |
|---|---|---|---|---|---|---|
| Echelon Insights | Aug 31 – Sep 7, 2022 | 102 (LV) | ± 6.1% | 38% | 54% | 8% |
South Carolina primary[edit]
- Aggregate polls
| Source of poll aggregation |
Dates administered |
Dates updated |
Nikki Haley |
Donald Trump |
Other/ Undecided[wj] |
Margin |
|---|---|---|---|---|---|---|
| 270toWin | February 16–20, 2024 | February 21, 2024 | 34.6% | 61.6% | 3.8% | Trump +27.0 |
| FiveThirtyEight | through February 23, 2024 | February 24, 2024 | 34.0% | 61.6% | 4.4% | Trump +27.6 |
| RealClearPolling | February 14, 2024 – February 23, 2024 | February 23, 2024 | 37.5% | 60.8% | 1.7% | Trump +23.3 |
| Poll source | Date(s) administered |
Sample size[b] |
Margin of error |
Doug Burgum |
Chris Christie |
Ron DeSantis |
Nikki Haley |
Asa Hutchinson |
Mike Pence |
Vivek Ramaswamy |
Tim Scott |
Donald Trump |
Other | Undecided |
|---|---|---|---|---|---|---|---|---|---|---|---|---|---|---|
| Trafalgar Group | Feb 21–23, 2024 | 1093 (LV) | ± 2.9% | – | – | – | 37.5% | – | – | – | – | 58.9% | – | 3.6%[wk] |
| Suffolk University/USA Today | Feb 15–18, 2024 | 500 (LV) | ± 4.4% | – | – | – | 35% | – | – | – | – | 63% | – | 2%[wl] |
| Emerson College/The Hill | Feb 15–17, 2024 | 1197 (LV) | ± 2.8% | – | – | – | 35.4% | – | – | – | – | 57.9% | – | 6.7% |
| Insider Advantage | Feb 14–15, 2024 | 800 (LV) | ± 3.9% | – | – | – | 38% | – | – | – | – | 60% | 1% | 1% |
| Trafalgar Group | Feb 13–15, 2024 | 1,089 (LV) | ± 2.9% | – | – | – | 33.6% | – | – | – | – | 63.3% | – | 3% |
| The Citadel | Feb 5–11, 2024 | 505 (LV) | ± 5.7% | – | – | – | 31% | – | – | – | – | 64% | 3% | 2% |
| Winthrop University | Feb 2–10, 2024 | 749 (LV) | ± 3.6% | – | – | – | 28.7% | – | – | – | – | 64.9% | 3.3% | 2% |
| Washington Post/Monmouth University | Jan 26–30, 2024 | 815 (LV) | ± 3.9% | – | – | – | 32% | – | – | – | – | 58% | 2% | 8% |
| Fabrizio, Lee & Associates | Jan 28–29, 2024 | 600 (LV) | ± 4.0% | – | – | – | 31% | – | – | – | – | 66% | – | 4% |
| The Tyson Group/The American Promise | Jan 24–26, 2024 | 543 (LV) | ± 4.4% | – | – | – | 31% | – | – | – | – | 58% | – | 11% |
| Fabrizio, Lee & Associates | Jan 17–18, 2024 | 600 (LV) | ± 4.0% | – | – | – | 28% | – | – | – | – | 68% | – | 4% |
| Emerson College | Jan 2–3, 2024 | 584 (LV) | ± 4.0% | – | 4.8% | 6.6% | 25.1% | 0.2% | – | 3.1% | – | 54.4% | – | 1.9% |
| Trafalgar Group | Dec 6–8, 2023 | 1,087 (LV) | ± 2.9% | – | 5.8% | 14.4% | 22.8% | 0.3% | – | 6.1% | – | 48.7% | – | 1.9% |
| Morning Consult | Nov 1–30, 2023 | 856 (LV) | – | 0% | 2% | 13% | 19% | – | – | 3% | 7% | 57% | – | – |
| Winthrop University Center for Public Opinion & Policy Research | Nov 4–12, 2023 | 780 (RV) | ± 3.51% | 0.3% | 1.6% | 12.5% | 18.7% | 0.4% | – | 3.4% | 10.6% | 47.6% | 2.1%[wm] | 2.7% |
| Morning Consult | Oct 1–31, 2023 | 927 (LV) | – | 0% | 1% | 11% | 15% | 0% | 3% | 6% | 7% | 58% | – | – |
| CNN/SSRS | Oct 18–25, 2023 | 738 (LV) | ± 4.8% | 0% | 2% | 11% | 22% | 0%[uo] | 2% | 1% | 6% | 53% | 0%[wn] | 1% |
| Morning Consult | Sep 1–30, 2023 | 854 (LV) | – | – | 1% | 10% | 13% | 0% | 3% | 6% | 7% | 59% | 0%[wo] | 1% |
| Fox Business | Sep 14–18, 2023 | 809 (LV) | ± 3.5% | <0.5% | 4% | 10% | 18% | 1% | 4% | 5% | 9% | 46% | 1%[wp] | 3% |
| Washington Post/Monmouth University | Sep 6–11, 2023 | 506 (LV) | ± 4.6% | 0% | 5% | 9% | 18% | 2% | 3% | 3% | 10% | 46% | 1%[wq] | 4% |
| Morning Consult | Aug 1–31, 2023 | 910 (LV) | – | – | 1% | 14% | 11% | 0% | 4% | 8% | 7% | 55% | 0%[wo] | – |
| Trafalgar Group (R) | Aug 17–19, 2023 | 1,054 (LV) | ± 2.9% | 0% | 2% | 14% | 8% | 0% | 2% | 6% | 14% | 48% | 0%[wr] | 1% |
| Morning Consult | July 1–31, 2023 | 907 (LV) | – | 0% | 1% | 15% | 12% | 1% | 3% | 6% | 7% | 54% | 0%[ws] | 1% |
| Fox Business | Jul 15–19, 2023 | 809 (LV) | ± 3.5% | <0.5% | 2% | 13% | 14% | 1% | 4% | 3% | 10% | 48% | –[wt] | 4% |
| Morning Consult | June 1–30, 2023 | 907 (LV) | – | 0% | 1% | 20% | 12% | 0% | 4% | 3% | 10% | 48% | 1%[wu] | 1% |
| National Public Affairs | Jun 20–21, 2023 | 809 (LV) | – | 1% | 5% | 18% | 12% | 2% | 2% | 2% | 10% | 41% | – | 6% |
| Morning Consult | May 1–31, 2023 | 875 (LV) | – | – | – | 19% | 13% | 0% | 4% | 3% | 7% | 52% | 1%[wv] | 1% |
| National Research[AC] | May 24–25, 2023 | 500 (LV) | ± 4.38% | – | – | 18% | 10% | 1% | 1% | 1% | 12% | 43% | 1%[ww] | 13% |
| National Public Affairs | May 15–17, 2023 | 590 (LV) | ± 4.0% | – | – | 23% | 15% | 3% | 2% | 2% | 10% | 38% | – | 8% |
| Morning Consult | Apr 1–30, 2023 | 810 (LV) | – | – | – | 17% | 17% | 0% | 5% | 1% | 4% | 52% | 3%[wx] | 1% |
| National Public Affairs | Apr 11–14, 2023 | 588 (LV) | ± 4.2% | – | – | 21% | 19% | 1% | 2% | 1% | 7% | 43% | 1%[wy] | 6% |
| Winthrop University | Mar 25 – April 1, 2023 | 485 (RV) | ± 4.6% | – | – | 20% | 18% | 0% | 5% | – | 7% | 41% | 5%[wz] | 4% |
| Morning Consult | Mar 1–31, 2023 | 806 (LV) | – | – | – | 22% | 15% | – | 5% | 0% | 4% | 49% | 3%[xa] | 2% |
| Morning Consult | Feb 1–28, 2023 | 689 (LV) | – | – | – | 24% | 18% | – | 5% | – | 7% | 43% | 4%[xb] | – |
| Neighbourhood Research and Media[R] | Feb 7–14, 2023 | 300 (LV) | ± 5.9% | – | – | 22% | 16% | – | 2% | – | 2% | 35% | – | 23% |
| Morning Consult | Jan 1–31, 2023 | 974 (LV) | – | – | – | 31% | 14% | – | 2% | – | 5% | 45% | 2%[xc] | 1% |
| Trafalgar Group | Jan 24–26, 2023 | 1,078 (LV) | ± 2.9% | – | – | – | 33% | – | 6% | – | – | 52% | 9%[xd] | – |
| – | – | – | 21% | – | 3% | – | 23% | 48% | 5%[xe] | – | ||||
| – | – | 29% | 22% | – | 4% | – | – | 43% | 2%[xf] | – | ||||
| – | – | 28% | 12% | – | 2% | – | 14% | 43% | 1%[xg] | – | ||||
| Moore Information | Jan 18–24, 2023 | 450 (LV) | ± 5.0% | – | – | 31% | 12% | – | 4% | – | 5% | 41% | – | 7% |
| – | – | – | 29% | – | – | – | – | 62% | – | 9% | ||||
| – | – | 42% | – | – | – | – | – | 49% | – | 15% | ||||
| Spry Strategies | Jan 17–19, 2023 | 386 (LV) | – | – | – | 52% | – | – | – | – | – | 33% | – | 15% |
| Morning Consult | Dec 1–31, 2022 | 530 (LV) | – | – | – | 28% | 13% | – | 4% | – | 5% | 44% | 6%[xh] | – |
| Winthrop University | Oct 22 – November 5, 2022 | 1,298 (A) | ± 2.8% | – | – | – | 37% | – | – | – | – | 45% | – | 19% |
| Echelon Insights | Aug 31 – September 7, 2022 | 294 (LV) | ± 5.1% | – | – | 33% | – | – | – | – | – | 58% | – | 9% |
| Trafalgar Group | Mar 25–29, 2021 | 1,014 (LV) | ± 3.0% | – | – | – | – | – | – | – | – | 64% | 11%[xi] | 25%[xj] |
Tennessee primary[edit]
| Poll source | Date(s) administered |
Sample size |
Margin of error |
Doug Burgum |
Chris Christie |
Ron DeSantis |
Nikki Haley |
Asa Hutchinson |
Mike Pence |
Vivek Ramaswamy |
Tim Scott |
Donald Trump |
Other | Undecided |
|---|---|---|---|---|---|---|---|---|---|---|---|---|---|---|
| Targoz Market Research[AD] | Dec 14–28, 2023 | 522 (LV) | ± 2.66% | – | 1% | 12% | 7% | 0% | – | 2% | – | 72% | 1% | 6% |
| Morning Consult | Nov 1–30, 2023 | 1,078 (LV) | – | 0% | 2% | 17% | 8% | 1% | – | 4% | 1% | 66% | – | 1% |
| Morning Consult | Oct 1–31, 2023 | 1,061 (LV) | – | 0% | 1% | 14% | 6% | 0% | 6% | 5% | 2% | 63% | – | 3% |
| Morning Consult | Sep 1–30, 2023 | 1,032 (LV) | – | 0% | 2% | 15% | 5% | 0% | 5% | 6% | 2% | 63% | 0%[xk] | 2% |
| Morning Consult | Aug 1–31, 2023 | 1,109 (LV) | – | 1% | 2% | 13% | 2% | 1% | 8% | 10% | 3% | 59% | 0%[xl] | 1% |
| Morning Consult | July 1–31, 2023 | 1,079 (LV) | – | 0% | 2% | 17% | 2% | 0% | 10% | 9% | 2% | 57% | 0%[xl] | 1% |
| Morning Consult | June 1–30, 2023 | 1,072 (LV) | – | 0% | 1% | 21% | 3% | 0% | 9% | 3% | 3% | 59% | 1%[xm] | – |
| The Beacon Center | Jun 14–22, 2023 | 502 (LV) | – | – | – | 12% | – | – | 8% | 1% | 1% | 61% | – | 9% |
| Morning Consult | May 1–31, 2023 | 1,147 (LV) | – | – | – | 18% | 3% | 0% | 7% | 2% | 1% | 64% | 3%[xn] | 2% |
| Morning Consult | Apr 1–30, 2023 | 986 (LV) | – | – | – | 22% | 3% | 0% | 8% | 1% | 1% | 61% | 5%[xo] | – |
| Vanderbilt University | Apr 19–23, 2023 | 1,003 (RV) | ± 3.6% | – | – | 25% | 4% | 2% | 5% | – | 3% | 59% | – | – |
| – | – | 38% | – | – | – | – | – | 57% | – | – | ||||
| Morning Consult | Mar 1–31, 2023 | 1,027 (LV) | – | – | – | 25% | 3% | – | 8% | – | 1% | 59% | 5%[xp] | – |
| Morning Consult | Feb 1–28, 2023 | 980 (LV) | – | – | – | 29% | 3% | – | 8% | – | 0% | 55% | 5%[xq] | – |
| Morning Consult | Jan 1–31, 2023 | 1,265 (LV) | – | – | – | 35% | 1% | – | 10% | – | 1% | 47% | 6%[xr] | 1% |
| Morning Consult | Dec 1–31, 2022 | 698 (LV) | – | – | – | 34% | 0% | – | 10% | – | 1% | 51% | 3%[xs] | 1% |
| Vanderbilt University | Nov 8–28, 2022 | 474 (RV) | ± 3.4% | – | – | 54% | – | – | – | – | – | 41% | – | 5% |
Texas primary[edit]
| Poll source | Date(s) administered |
Sample size[b] |
Margin of error |
Doug Burgum |
Chris Christie |
Ron DeSantis |
Nikki Haley |
Asa Hutchinson |
Mike Pence |
Vivek Ramaswamy |
Tim Scott |
Donald Trump |
Other | Undecided |
|---|---|---|---|---|---|---|---|---|---|---|---|---|---|---|
| YouGov[AE] | Dec 1–10, 2023 | 552 (RV) | ± 4.17% | 1% | 2% | 12% | 9% | – | – | 4% | – | 65% | 2%[xt] | 6% |
| Morning Consult | Nov 1–30, 2023 | 3,064 (LV) | – | 1% | 2% | 12% | 7% | 1% | – | 7% | 1% | 69% | – | – |
| CWS Research[AF] | Nov 20–22, 2023 | 458 (LV) | ± 4.579% | 0% | 3% | 11% | 11% | – | – | 2% | – | 61% | – | 11% |
| – | – | 22% | – | – | – | – | – | 63% | – | 14% | ||||
| – | – | – | 20% | – | – | – | – | 70% | – | 10% | ||||
| Morning Consult | Oct 1–31, 2023 | 3,187 (LV) | – | 0% | 2% | 11% | 6% | 0% | 5% | 7% | 2% | 66% | 0%[xu] | 1% |
| YouGov[AE] | Oct 5–17, 2023 | 568 (RV) | ± 4.11% | 0% | 1% | 13% | 7% | 1% | 3% | 3% | 1% | 62% | 3%[xv] | 5% |
| CWS Research[AF] | October 5–9, 2023 | 418 (LV) | ± 4.793% | 0% | 1% | 9% | 11% | N/A | 2% | 5% | 1% | 58% | – | 13% |
| – | – | 24% | – | – | – | – | – | 59% | – | 17% | ||||
| Morning Consult | Sep 1–30, 2023 | 3,099 (LV) | – | 1% | 1% | 13% | 4% | 1% | 5% | 9% | 2% | 62% | 0%[xw] | 2% |
| CWS Research[AF] | Sep 1–4, 2023 | 406 (LV) | ± 4.864% | 0% | 2% | 10% | 5% | 1% | 5% | 3% | 1% | 61% | 2%[xx] | 10% |
| – | – | 24% | – | – | – | – | – | 62% | – | 14% | ||||
| Morning Consult | Aug 1–31, 2023 | 3,070 (LV) | – | 0% | 2% | 12% | 3% | 0% | 7% | 11% | 3% | 61% | 1%[xy] | – |
| CWS Research[AF] | Jul 30–31, 2023 | 606 (LV) | ± 3.981% | 0% | 4% | 13% | 3% | 1% | 4% | 4% | 5% | 48% | 3%[xz] | 15% |
| – | – | 29% | – | – | – | – | – | 53% | – | 19% | ||||
| Morning Consult | July 1–31, 2023 | 3,156 (LV) | – | 0% | 1% | 15% | 3% | 0% | 8% | 9% | 4% | 59% | 0%[ya] | 1% |
| CWS Research[AF] | Jun 28–30, 2023 | 764 (LV) | ± 3.546% | 0% | 3% | 19% | 4% | 1% | 5% | 2% | 3% | 51% | 3%[yb] | 10% |
| – | – | 32% | – | – | – | – | – | 53% | – | 15% | ||||
| Morning Consult | June 1–30, 2023 | 2,929 (LV) | – | 0% | 1% | 18% | 3% | 1% | 7% | 4% | 3% | 59% | 2%[yc] | 2% |
| Morning Consult | May 1–31, 2023 | 2,829 (LV) | – | – | – | 19% | 4% | 0% | 5% | 3% | 2% | 58% | 7%[yd] | 2% |
| CWS Research[AF] | May 26–30, 2023 | 1,024 (LV) | ± 3.07% | – | – | 23% | 3% | 2% | 4% | 2% | 3% | 47% | 4%[ye] | 13% |
| – | – | 33% | – | – | – | – | – | 51% | – | 16% | ||||
| Texas Hispanic Policy Foundation | May 8–17, 2023 | 1,000 (RV) | ± 2.9% | – | – | 36% | – | – | – | – | – | 57% | 2%[yf] | 5% |
| CWS Research | Apr 29 – May 1, 2023 | 699 (LV) | ± 3.7% | – | – | 16% | 5% | 0% | 3% | 3% | 1% | 54% | 4%[yg] | 15% |
| Morning Consult | Apr 1–30, 2023 | 2,736 (LV) | – | – | – | 20% | 3% | 0% | 6% | 2% | 1% | 57% | 9%[yh] | 2% |
| CWS Research[AF] | Mar 30 – Apr 2, 2023 | 1,067 (LV) | ± 3.0% | – | – | 20% | 4% | – | 5% | 2% | 1% | 52% | 5%[yi] | 12% |
| Morning Consult | Mar 1–31, 2023 | 2,629 (LV) | – | – | – | 24% | 4% | – | 7% | 0% | 1% | 53% | 11%[yj] | – |
| CWS Research[AF] | Feb 28 – Mar 2, 2023 | 879 (LV) | ± 3.3% | – | – | 27% | 5% | – | 4% | 2% | 1% | 43% | 5%[yk] | 13% |
| Morning Consult | Feb 1–28, 2023 | 2,376 (LV) | – | – | – | 27% | 3% | – | 6% | 0% | 1% | 51% | 12%[yl] | – |
| Morning Consult | Jan 1–31, 2023 | 3,187 (LV) | – | – | – | 28% | 2% | – | 9% | – | 0% | 48% | 13%[ym] | – |
| Morning Consult | Dec 1–31, 2022 | 1,871 (LV) | – | – | – | 30% | 2% | – | 8% | – | 0% | 45% | 15%[yn] | – |
| CWS Research[AF] | Dec 19–21, 2022 | 1,051 (LV) | ± 3.0% | – | – | 36% | 4% | – | 4% | – | 1% | 37% | 7%[yo] | 11% |
| CWS Research[AF] | Nov 27–28, 2022 | 860 (LV) | ± 3.3% | – | – | 34% | 4% | – | 5% | – | 1% | 37% | 5%[yp] | 13% |
| CWS Research[AG] | Nov 12–13, 2022 | 1,099 (LV) | ± 3.0% | – | – | 43% | 4% | – | 5% | – | 1% | 32% | 1%[yq] | 14% |
| CWS Research[AF] | Oct 19–23, 2022 | 823 (RV) | – | – | – | 29% | 3% | – | 4% | – | – | 46% | 7%[yr] | 11% |
| Echelon Insights | Aug 31 – Sep 7, 2022 | 378 (LV) | ± 4.4% | – | – | 37% | – | – | – | – | – | 53% | – | 10% |
| CWS Research[AF] | Aug 9–11, 2022 | 1,581 (RV) | ± 2.5% | – | – | 21% | 5% | – | 6% | – | – | 51% | 7%[ys] | 10% |
| CWS Research[AF] | Jul 9–10, 2022 | 1,918 (RV) | ± 2.2% | – | – | 26% | 5% | – | 6% | – | – | 45% | 20%[yt] | 9% |
| CWS Research[AF] | Jun 7–8, 2022 | 665 (RV) | ± 3.8% | – | – | 26% | 4% | – | 5% | – | – | 49% | 8%[yu] | 8% |
| CWS Research[AF] | May 4–10, 2022 | 992 (LV) | ± 3.1% | – | – | 28% | 7% | – | – | – | – | 44% | 13%[yv] | 8% |
| CWS Research[AF] | Mar 29 – Apr 1, 2022 | 678 (LV) | ± 3.8% | – | – | 20% | 10% | – | – | – | – | 46% | 16%[yw] | 8% |
Polls without Donald Trump
| ||||||||||||||||||||||||||||||||||||||||||||||||||||||||||||||||||||||||||||||||||||||||||||||||||||||||||||
|---|---|---|---|---|---|---|---|---|---|---|---|---|---|---|---|---|---|---|---|---|---|---|---|---|---|---|---|---|---|---|---|---|---|---|---|---|---|---|---|---|---|---|---|---|---|---|---|---|---|---|---|---|---|---|---|---|---|---|---|---|---|---|---|---|---|---|---|---|---|---|---|---|---|---|---|---|---|---|---|---|---|---|---|---|---|---|---|---|---|---|---|---|---|---|---|---|---|---|---|---|---|---|---|---|---|---|---|---|
|
Utah caucus[edit]
| Poll source | Date(s) administered |
Sample size[b] |
Margin of error |
Chris Christie |
Ron DeSantis |
Nikki Haley |
Mike Pence |
Vivek Ramaswamy |
Tim Scott |
Donald Trump |
Other | Undecided |
|---|---|---|---|---|---|---|---|---|---|---|---|---|
| Dan Jones & Associates | Oct 12–23, 2023 | 509 (RV) | – | 3% | 14% | 13% | 5% | 4% | 1% | 30% | – | 20% |
| Dan Jones & Associates | Sep 24–29, 2023 | 802 (RV) | ± 4.32% | 4% | 15% | 11% | 5% | 5% | 1% | 33% | 6% | 22% |
| Dan Jones & Associates | Aug 7–14, 2023 | 476 (RV) | ± 4.49% | 4% | 19% | 4% | 9% | 5% | 2% | 27% | 18%[zb] | 13% |
| Noble Perspective Insights | Jul 7–18, 2023 | 301 (RV) | ± 5.65% | 2% | 18% | 3% | 10% | 6% | 3% | 48% | 10%[zc] | – |
| Dan Jones & Associates | Jun 26 – Jul 4, 2023 | 495 (RV) | ± 4.4% | 4% | 24% | 3% | 6% | 2% | 2% | 29% | 13%[zd] | 16% |
| Dan Jones & Associates | May 22 – Jun 1, 2023 | 421 (RV) | ± 4.8% | – | 26% | 5% | 5% | 4% | 3% | 27% | 16%[ze] | 16% |
| Dan Jones & Associates | April 25–28, 2023 | 800 (RV) | ± 3.5% | – | 19% | 8% | 6% | – | – | 21% | 24%[zf] | 22% |
| WPA Intelligence[AH] | April 18–20, 2023 | 504 (RV) | ± 4.0% | – | 46% | – | – | – | – | 35% | – | 19% |
| OH Predictive Insights | March 14–23, 2023 | 302 (RV) | ± 5.6% | – | 23% | 5% | 10% | – | 0% | 41% | 5%[zg] | – |
| Dan Jones & Associates | March 14–22, 2023 | 801 (RV) | ± 3.5% | – | 31% | 5% | 4% | – | – | 23% | 12%[zh] | – |
| OH Predictive Insights | Dec 27, 2022 – Jan 4, 2023 | 302 (RV) | ± 5.6% | 1% | 29% | 3% | 11% | – | – | 42% | 12%[zi] | 2% |
| Dan Jones & Associates | Nov 18–23, 2022 | 802 (RV) | ± 3.5% | – | 24% | 4% | 6% | – | – | 15% | 30%[zj] | 21% |
| OH Predictive Insights | Nov 5–15, 2021 | 333 (RV) | ± 5.4% | 1% | 7% | 4% | 9% | – | – | 43% | 25%[zk] | 10% |
| 1% | 18% | 5% | 13% | – | – | – | 32%[zl] | 20% |
Virginia primary[edit]
| Poll source | Date(s) administered |
Sample size[qq] |
Margin of error |
Doug Burgum |
Chris Christie |
Ron DeSantis |
Larry Elder |
Nikki Haley |
Asa Hutchinson |
Mike Pence |
Vivek Ramaswamy |
Tim Scott |
Donald Trump |
Glenn Youngkin |
Other | Undecided |
|---|---|---|---|---|---|---|---|---|---|---|---|---|---|---|---|---|
| Roanoke College | Feb 11–19, 2024 | 392 (LV) | ± 4.6% | – | – | – | – | 43% | – | – | – | – | 51% | – | – | – |
| Morning Consult | Jan 23 – February 4, 2024 | 436 (LV) | – | – | – | – | – | 19% | – | – | – | – | 78% | – | – | – |
| Morning Consult | Nov 1–30, 2023 | 942(LV) | – | 0% | 5% | 14% | – | 9% | – | – | 7% | 1% | 63% | – | – | 1% |
| Roanoke College | Nov 12–20, 2023 | 686 (A) | ± 4.3% | 0% | 2% | 14% | – | 10% | – | – | 3% | 1% | 51% | 10% | – | 9% |
| Morning Consult | Oct 1–31, 2023 | 942 (LV) | – | 0% | 3% | 10% | – | 8% | 0% | 5% | 8% | 3% | 63% | – | 0%[zm] | – |
| Morning Consult | Sep 1–30, 2023 | 896 (LV) | – | 0% | 3% | 14% | – | 6% | 0% | 4% | 9% | 1% | 61% | – | 0%[zn] | 2% |
| Morning Consult | Aug 1–31, 2023 | 947 (LV) | – | 0% | 4% | 15% | – | 3% | 1% | 5% | 10% | 2% | 59% | – | 0%[zo] | 1% |
| Roanoke College | Aug 6–15, 2023 | 702 (A) | ± 4.2% | – | 3% | 13% | 1% | 2% | 1% | 7% | 5% | 6% | 47% | 9% | 6%[zp] | 2% |
| Morning Consult | July 1–31, 2023 | 1,044(LV) | – | 0% | 4% | 20% | – | 4% | 0% | 7% | 7% | 3% | 55% | – | 0%[zq] | – |
| Morning Consult | June 1–30, 2023 | 919 (LV) | – | 0% | 2% | 19% | – | 5% | 0% | 7% | 3% | 3% | 60% | – | 0%[zr] | 1% |
| Morning Consult | May 1–31, 2023 | 969 (LV) | – | – | – | 21% | – | 3% | 0% | 6% | 3% | 2% | 59% | 3% | 3%[zs] | – |
| Roanoke College | May 14–23, 2023 | 678 (A) | ± 4.4% | – | – | 28% | 1% | 7% | 1% | 7% | – | 1% | 48% | – | 3%[zt] | 4% |
| Morning Consult | Apr 1–30, 2023 | 870 (LV) | – | – | – | 20% | – | 3% | 0% | 6% | 2% | 1% | 59% | 6% | 3%[zu] | 1% |
| Morning Consult | Mar 1–31, 2023 | 921 (LV) | – | – | – | 26% | – | 3% | – | 6% | 1% | 0% | 50% | 9% | 3%[zv] | 2% |
| Morning Consult | Feb 1–28, 2023 | 721 (LV) | – | – | – | 31% | – | 4% | – | 6% | 1% | 1% | 47% | 9% | 1%[zw] | – |
| Differentiators | Feb 21–24, 2023 | 500 (LV) | ± 4.5% | – | – | 37% | – | 6% | – | 3% | 2% | – | 34% | 6% | 7%[zx] | 5% |
| – | – | 54% | – | – | – | – | – | – | 37% | – | – | 9% | ||||
| – | – | 65% | – | – | – | – | – | – | – | 27% | – | 8% | ||||
| – | – | – | – | – | – | – | – | – | 52% | 42% | – | 6% | ||||
| Roanoke College | Feb 12–21, 2023 | 680 (A) | ± 4.2% | – | – | 28% | – | 5% | – | 3% | – | – | 39% | 6% | 6%[zy] | 13% |
| Morning Consult | Jan 1–31, 2023 | 1,000 (LV) | – | – | – | 32% | – | 2% | – | 10% | – | 1% | 43% | 8% | 2%[zz] | 2% |
| Morning Consult | Dec 1–31, 2022 | 559 (LV) | – | – | – | 30% | – | 2% | – | 11% | – | 1% | 45% | 7% | 5%[aaa] | – |
| Roanoke College | Nov 13–22, 2022 | 652 (A) | ± 4.5% | – | – | – | – | – | – | – | – | – | 52% | 39% | – | 7% |
| Roanoke College | Aug 7–16, 2022 | 640 (A) | ± 4.5% | – | – | – | – | – | – | – | – | – | 62% | 28% | – | 9% |
West Virginia primary[edit]
| Poll source | Date(s) administered |
Sample size[b] |
Margin of error |
Ron DeSantis |
Nikki Haley |
Asa Hutchinson |
Mike Pence |
Vivek Ramaswamy |
Tim Scott |
Donald Trump |
Other | Undecided |
|---|---|---|---|---|---|---|---|---|---|---|---|---|
| ECU Center for Survey Research | May 22–23, 2023 | 957 (RV) | ± 3.7% | 9% | 3% | 2% | 5% | 2% | 4% | 54% | – | 20% |
Wisconsin primary[edit]
| Source of poll aggregation |
Dates administered |
Dates updated |
Nikki Haley |
Donald Trump |
Other/ Undecided[aab] |
Margin |
|---|---|---|---|---|---|---|
| 270ToWin | February 7, 2024 | February 15, 2024 | 22.5% | 71.5% | 6.0% | Trump +49.0 |
| FiveThirtyEight | through February 4, 2024 | February 15, 2024 | 21.1% | 70.9% | 8.0% | Trump +49.8 |
| Poll source | Date(s) administered |
Sample size[b] |
Margin of error |
Doug Burgum |
Chris Christie |
Ron DeSantis |
Nikki Haley |
Asa Hutchinson |
Mike Pence |
Vivek Ramaswamy |
Tim Scott |
Donald Trump |
Other | Undecided |
|---|---|---|---|---|---|---|---|---|---|---|---|---|---|---|
| Public Policy Polling (D) | Dec 11–12, 2023 | 503 (LV) | ± 4.4% | – | 5% | 16% | 15% | – | – | 4% | – | 54% | – | 6% |
| Morning Consult | Nov 1–30, 2023 | 720 (LV) | – | 1% | 2% | 17% | 13% | 1% | – | 6% | 2% | 56% | – | 2% |
| Marquette University Law School | October 26 – November 2, 2023 | 402 (RV) | ± 6.8% | 1% | 1% | 18% | 11% | 0% | 6% | 3% | 1% | 38% | 0%[aac] | 24% |
| Morning Consult | Oct 1–31, 2023 | 713 (LV) | – | 0% | 3% | 15% | 12% | 1% | 4% | 9% | 3% | 52% | – | 1% |
| Morning Consult | Sep 1–30, 2023 | 665 (LV) | – | – | 2% | 16% | 9% | 1% | 7% | 11% | 2% | 50% | 0%[aad] | 2% |
| Morning Consult | Aug 1–31, 2023 | 681 (LV) | – | – | 3% | 16% | 6% | 2% | 8% | 11% | 5% | 50% | 0%[aae] | – |
| Morning Consult | July 1–31, 2023 | 707 (LV) | – | 0% | 2% | 25% | 5% | 1% | 8% | 8% | 4% | 46% | 1%[aaf] | – |
| Morning Consult | June 1–30, 2023 | 666 (LV) | – | – | 2% | 24% | 3% | 0% | 7% | 6% | 7% | 51% | 1%[aag] | – |
| Marquette Law School | June 8–13, 2023 | 419 (RV) | ± 6.5% | 0% | 1% | 30% | 3% | 0% | 6% | 3% | 5% | 31% | 0%[aah] | 21% |
| Public Policy Polling | June 5–6, 2023 | 507 (LV) | ± 4.4% | – | – | 25% | 5% | – | 8% | 2% | 5% | 41% | – | 14% |
| – | – | 39% | – | – | – | – | – | 43% | – | 18% | ||||
| Morning Consult | May 1–31, 2023 | 728 (LV) | – | – | – | 24% | 4% | 0% | 8% | 5% | 3% | 52% | 4%[aai] | – |
| Morning Consult | Apr 1–30, 2023 | 771 (LV) | – | – | – | 31% | 4% | 0% | 9% | 2% | 2% | 45% | 5%[aaj] | 2% |
| Morning Consult | Mar 1–31, 2023 | 722 (LV) | – | – | – | 35% | 6% | – | 9% | 1% | 2% | 43% | 4%[aak] | – |
| Morning Consult | Feb 1–28, 2023 | 626 (LV) | – | – | – | 34% | 4% | – | 9% | 0% | 1% | 44% | 7%[aal] | 1% |
| Morning Consult | Jan 1–31, 2023 | 897 (LV) | – | – | – | 32% | 2% | – | 11% | – | 2% | 42% | 10%[aam] | 1% |
| Morning Consult | Dec 1–31, 2022 | 558 (LV) | – | – | – | 36% | 4% | – | 9% | – | 1% | 40% | 8%[aan] | 2% |
Maps[edit]

1%
2%
No polls above 1% in the past 6 months

1%
2%
4%
7%
No polls above 1% in the past 6 months

7%
10%
15%
20%
30%
No polls above 1% in the past 6 months

1%
No polls above 1% in the past 6 months

2%
4%
7%
10%
15%
No polls above 1% in the past 6 months

1%
2%
No polls above 1% in the past 6 months

1%
2%
4%
7%
10%
No polls above 1% in the past 6 months

1%
2%
4%
7%
10%
No polls above 1% in the past 6 months

1%
2%
4%
7%
No polls above 1% in the past 6 months

20%
30%
40%
50%
60%+
No polls above 1% in the past 6 months
See also[edit]
- 2024 Republican National Convention
- Nationwide opinion polling for the 2024 Democratic Party presidential primaries
- Nationwide opinion polling for the 2024 United States presidential election
Notes[edit]
- ^ Calculated by taking the difference of 100% and all other candidates combined.
- ^ a b c d e f g h i j k l m n o p q r s t u v w x y z Key:
A – all adults
RV – registered voters
LV – likely voters
V – unclear - ^ Cheney at 1%; Someone Else at 2%; Don't know at 6%
- ^ Someone Else at 1%; Not Sure at 10%; Would Not Vote at 4%
- ^ Undecided at 6%
- ^ Someone Else at 1%
- ^ Other at 3%; Don't Know at 20%
- ^ Binkley at 0.2%; Undecided at 3.1%
- ^ Other at 4%; No Opinion at 6%
- ^ Other at 1%; None at 2%; Would Not Vote at 1%
- ^ Binkley at 1%; Stapleton at 1%; Someone Else at 1%; Don't Know at 7%
- ^ Undecided at 5.2%
- ^ Not Sure at 9%; Would Not Vote at 2%
- ^ Other at 7%
- ^ Someone Else at 1%
- ^ Binkley at 0%; Someone Else at 1%; Don't Know at 9%
- ^ Cheney and Youngkin at 1%; Don't Know at 7%; None at 1%; Other at 0%
- ^ Someone Else 1%; Not Sure at 6%; Would Not Vote 5%
- ^ Undecided at 3%, Refused at 1%
- ^ Binkley at 0%; Stapleton at 0%; Someone Else at 1%; Unsure at 7%
- ^ Someone Else at 1%
- ^ Cheney at 3%; Cruz at 2%; Pompeo at 1%; Other at 1%
- ^ Binkley at 0%
- ^ Someone Else at 1%
- ^ Someone Else at 7%
- ^ Someone Else at 1%; Unsure at 5%
- ^ Someone Else at 1%; No Opinion at 1%
- ^ Undecided at 4%
- ^ Someone Else at 1%
- ^ Someone Else at 1%; Not Sure at 11%; Would Not Vote at 6%
- ^ Youngkin at 0.4%
- ^ Binkley at 0%; Someone Else and Stapleton at 0%; Undecided at 6%
- ^ Binkley at 0.5%; Someone Else at 1.5%
- ^ Undecided at 7.6%
- ^ Don't Know at 16%
- ^ Uncertain at 8%
- ^ Someone Else at 1%
- ^ Unsure at 3.8%
- ^ Binkley at 0.2%; No Opinion at 5.7%
- ^ Cheney at 0%; Don't Know at 9%; Someone Else at 2%
- ^ Undecided at 11%
- ^ Binkley at 0%
- ^ Not Sure at 14%; Would Not Vote at 2%
- ^ Cheney and Cruz at 2%; Pompeo at 1%; Other at 3%
- ^ Binkley at 1%; Stapleton at 0%; Someone Else at 2%; Unsure at 9%
- ^ Binkley at 0.2%; No Opinion at 11.5%
- ^ Someone Else at 1%
- ^ Undecided at 10.8%
- ^ Binkley at 0%; Undecided at 6%
- ^ Someone Else at 2.3%; Undecided at 7.6%
- ^ Undecided at 12%
- ^ Undecided at 9%
- ^ Binkley at 0.2%; Undecided at 2.0%
- ^ Someone Else 1%; Not Sure at 11%; Would Not Vote 4%
- ^ Cheney, Cruz, Hogan, Noem, Pompeo, Sununu, and Youngkin at 0%; Someone Else at 0%; Wouldn't Vote at 0%; Undecided at 4%; Refused at 1%
- ^ Someone Else at 1%
- ^ Uncertain at 13%
- ^ Cheney and Cruz at 2%; Pompeo at 0%; Other at 2%
- ^ Other at 0%; Don't Know at 6%
- ^ Someone Else at 1%
- ^ Someone Else at 1%; Not Sure at 9%
- ^ Youngkin at 1%; Cheney at 0%; Other at 1%; None at 1%; Don't Know at 14%
- ^ Binkley at 0.2%; Other at 0%; Undecided at 8.8%
- ^ Someone else at 1%
- ^ Someone Else at 1%; Unsure at 4%
- ^ Someone Else at 1%; Don't Know at 13%
- ^ Binkley at 0.1%; Someone Else at 1.7%
- ^ Cheney and Cruz at 2%; Pompeo at 1%; Other at 4%
- ^ Someone Else at 1%; Not Sure at 9%; Would Not Vote at 3%
- ^ Cheney at 2%; Romney at 1%; Perry at 0%; Undecided at 9%
- ^ Someone else at 1%
- ^ Other at 1%; Undecided at 9%
- ^ Binkley at 1%; Someone Else at 1%; Unsure at 8%
- ^ None of These at 2%; Don’t Know at 4%
- ^ Unsure at 12%; Would Not Vote at 1%
- ^ Undecided at 3%
- ^ Cheney and Sununu at 1%; Youngkin at 0%; Other at 1%; None at 1%; Don't Know at 7%
- ^ Someone else at 1%
- ^ Cheney at 2%; Cruz and Pompeo at 1%; Other at 5%
- ^ Someone Else at 2%; Not Sure at 10%; Would Not Vote at 1%
- ^ Someone else at 1%
- ^ Not sure at 9%
- ^ Perry and Youngkin at 0%; Unsure at 6%
- ^ Don't Know at 3%, None of the above 1%
- ^ Someone Else at 1%
- ^ Someone Else at 2%
- ^ None at 3%; Other at 0%
- ^ Not Sure at 9%; Would Not Vote at 1%
- ^ Someone Else at 1%
- ^ Cheney at 1%; Perry at 0%; Undecided at 7%
- ^ Someone else and no opinion at 1%
- ^ Unsure at 7%
- ^ Someone Else at 2%; Unsure at 9%
- ^ Binkley at 0.4%; Someone Else at 2.1%
- ^ Not Sure at 11%, Would Not Vote at 3%
- ^ Someone else with 1%
- ^ Others/Undecided at 17%
- ^ Cheney at 2%; Abbot, Noem, and someone else at 1%
- ^ Others/Undecided at 10%
- ^ Liz Cheney with 4%; Ted Cruz with 3%; Mike Pompeo with 1%; Other with 3%
- ^ Someone Else with 5%
- ^ Cheney at 2%; Abbott, Noem, and Someone Else at 1%
- ^ Romney with 3%; Cheney and Perry with 1%; Abbott, Bolton, Sununu, and Youngkin with 0%; Undecided at 8%
- ^ Cheney at 2%; Abbott, Noem, Sununu, and Youngkin at 1%; Others/Undecided at 6%
- ^ Youngkin, Sununu, Noem, Cheney, at 1%; Undecided at 4%
- ^ Cheney at 2%; Abbott and Someone Else at 1%; Noem at 0%; Undecided at 2%
- ^ Chris Sununu at 1%; No opinion at 1%
- ^ Cruz at 3%; Rubio at 1%; Other/Undecided at 8%
- ^ Other at 0.0%; Undecided at 11.3%
- ^ Chris Sununu with 1%; Undecided with 16%
- ^ Others/Undecided at 5%
- ^ Sununu with 1%; Others/Undecided with 14%
- ^ Cheney at 2%; Abbott at 1%; Noem at 0%, Someone Else at 2%
- ^ Liz Cheney at 2%; Greg Abbott and Kristi Noem at 1%
- ^ Others/Undecided with 10%
- ^ Other/Undecided at 5%
- ^ Cruz at 3%, Cheney at 1%, Pompeo at 0%, Other at 3%
- ^ Cheney and at 2%; Abbott, Noem, and Someone Else at 1%
- ^ Someone else at 4%
- ^ Cheney with 2%
- ^ Sununu at 1%; Others/Undecided at 17%
- ^ Cheney with 3%; Abbot, Noem, Youngkin, and someone else at 1%
- ^ Undecided with 14.5%
- ^ Cruz and Rubio with 1%, Someone Else with 2%
- ^ Others with 2%
- ^ Noem, Youngkin, Sununu at 1%, Others/Undecided at 14%
- ^ Cheney at 2%; Abbot, Noem, and Undecided at 1%
- ^ Cheney at 3%; Abbot, Noem, Pompeo, and Undecided at 1%
- ^ Cheney with 3%, Pompeo and Youngkin with 1%, Sununu with 0%, Other with 0%
- ^ Cheney at 3%; Pompeo and Sununu at 1%, Youngkin with 0%, Other with 1%
- ^ Cheney 2%; Abbot, Pompeo, with 1%, others 1%.
- ^ Cheney with 10.3%, Pompeo with 1.1%, Youngkin with 0.5%, Sununu with 0.1%
- ^ Noem, Pompeo, Sununu with 1%, Youngkin with 0%, Someone Else with 0%
- ^ Pompeo with 2%, Cheney, Hogan, and Youngkin with 0%
- ^ Noem with 1%, Hawley, Pompeo, R. Scott, Sununu, Youngkin with 0%, Someone Else with 1%
- ^ Cheney with 3%; Abbott, Noem, Pompeo, Youngkin with 1%
- ^ Noem with 1.5%, Pompeo with 1.2%, Undecided with 14.0%
- ^ Cheney with 3%, Abbott with 2%, Noem, Pompeo, and Sununu with 1%, Youngkin with 0%, Other with 1%
- ^ Cheney with 3%; Abbott with 2%; Noem, Pompeo, Sununu with 1%
- ^ Cruz and Noem with 2%; Pompeo, Youngkin, and Sununu with 1%
- ^ Cruz with 2%, Pompeo and Rubio with 1%, Someone Else with 2%
- ^ Cruz, Paul, and Rice with 1%, Pompeo with <1%, Others with 3%
- ^ Liz Cheney with 3%; Greg Abbott, Kristi Noem, Mike Pompeo, Glenn Youngkin with 1%
- ^ Someone else with 10.4%
- ^ Cheney and Cruz with 2%; Noem, Pompeo, and Sununu with 1%; Youngkin with 0%; Undecided with 5%
- ^ Chris Sununu with 2%, Mike Pompeo and Glenn Youngkin with 1%; Someone else with 3%; "No opinion" with 1%
- ^ Ted Cruz with 4%; Liz Cheney with 3%, Other with 4%
- ^ Liz Cheney with 2%; Greg Abbott, Kristi Noem, Mike Pompeo, and Glenn Youngkin with 1%
- ^ Pompeo with 3%; Cheney with 1%; Hogan and Youngkin with 0%, Not Sure with 15%
- ^ Cruz with 2%, Pompeo with 1%, Rubio with 0%, Unsure with 17%
- ^ Hogan, Noem, and Pompeo with 1%, Sununu with 0%, Someone Else with 4%
- ^ Liz Cheney with 3%; Abbott, Noem, Pompeo with 1%; Youngkin with 0%
- ^ Romney with 3%, Cheney and Pompeo with 2%, Abbott, Bolton, Hogan, Sununu, and Youngkin with 1%, Undecided with 9%
- ^ Abbott and Liz Cheney with 2%; Noem, Pompeo, Youngkin with 1%; Hogan and Sununu with 0%, Others with 5%
- ^ Noem with 1%
- ^ Someone Else with 10.8%
- ^ Pompeo with 3%, Rubio with 2%, Cruz with 1%, Someone Else with 1%, Unsure with 9%
- ^ Noem with 1%
- ^ Undecided with 5%
- ^ Pompeo with 4%, Cruz with 2%, Cheney with 1%, Hogan, Noem, Sununu, and Youngkin with 0%, Undecided with 4%
- ^ Noem with 1%
- ^ Cheney with 1.9%, Pompeo with 1.8%, Hogan with 1.2%, Youngkin with 0.6%, Sununu with 0.5%, Other with 0.6%
- ^ Noem with 1%
- ^ Noem with 1%
- ^ Pompeo with 3%, Cruz, Hogan, Noem, and Rubio with 1%, Other with 2%, Undecided with 11%
- ^ Noem with 1%
- ^ Cruz, Paul, and Pompeo with 1%, Others with 4%
- ^ Noem with 1%
- ^ Noem with 1%
- ^ Noem with 1%
- ^ Romney with 2%; Hawley, Noem, Bolton, Rick Scott, and Gabbard with 0%
- ^ Cheney with 3%, Kasich and Romney with 2%, Hogan, Pompeo, and Youngkin with 1%, Abbott, Bolton, Rubio, and Sununu with 0%, Undecided with 8%
- ^ Noem with 1%
- ^ Cheney with 3.6%, Cruz with 3.4%, Hogan with 0.7%, Hawley with 0.4%, Someone Else with 2.1%
- ^ Cheney with 4%, Noem, Hogan, Sununu, and Youngkin with 1%, Would Not Vote with 1%, Undecided with 13%
- ^ Cruz with 3.5%, Cheney with 2.7%, Sununu with 1.1%, Youngkin with 0.8%, Someone Else with 2.2%
- ^ Rubio with 3%
- ^ Cotton with 1%
- ^ Noem with 1%
- ^ Noem with 1%
- ^ Cruz with 2%, Youngkin with 0%, someone else with 1%
- ^ Noem with 1%
- ^ Noem with 1%
- ^ Cruz with 3%, Abbott, Carlson, and Cheney with 2%; Pompeo and Youngkin with 1%, Bolton, Hogan, and Sununu with 0%, Someone Else with 3%
- ^ Noem with 0%
- ^ Noem with 0%
- ^ Noem with 0%
- ^ Noem with 1%
- ^ Noem with 1%
- ^ Noem with 1%
- ^ Noem with 1%
- ^ Christie with 1%
- ^ Noem with 0%
- ^ Noem with 1%
- ^ Noem, Romney, Christie and Gabbard with 1%; Bolton, Hawley, Kemp, Suarez and Rick Scott with 0%
- ^ Kristi Noem with 2%; Rick Scott, Romney, Christie and Gabbard with 1%; Hawley, Kemp, Suarez and Bolton with 0%
- ^ Christie with 1%; Bolton, Kemp, Noem, Hutchinson, Hawley, Rick Scott and Crenshaw with 0%
- ^ Noem with 0%
- ^ Mitt Romney with 2%; Kasich and Bolton with 1%
- ^ Noem with 1%
- ^ Noem with 1%
- ^ Noem with 1%
- ^ Chris Christie with 3%
- ^ Chris Christie with 2%
- ^ Noem with 1%
- ^ Donald Trump Jr. with 9%
- ^ Chris Christie with 4%
- ^ Marjorie Taylor Greene with 1%; Bolton with 0%
- ^ Mitt Romney with 2%; Hawley with 1%; Noem, Rick Scott and Christie with 0%
- ^ Hawley with 0%
- ^ Romney with 1%; Gabbard, Bolton, Suarez, Noem, Hawley, Christie and Rick Scott with 0%
- ^ Romney with 1%; Bolton, Gabbard, Suarez, Noem, Hawley, Christie and Rick Scott with 0%
- ^ Mitt Romney with 2%; Cotton with 1%; Christie, Rick Scott, Noem and Hawley with 0%
- ^ Kristi Noem with 2%; Tucker Carlson with 1%
- ^ Mitt Romney with 2%; Cotton and Noem with 1%; Rick Scott and Hawley with 0%
- ^ Mitt Romney with 2%; Christie with 1%; Cotton, Noem and Rick Scott with 0%
- ^ Tom Cotton with 4%; Romney, Bolton and Kasich with 1%
- ^ Cotton, Hutchinson, Hawley, Crenshaw, Kemp, Noem, Christie and Rick Scott with 0%
- ^ Mitt Romney with 2%; Cotton and Kasich with 1%; Owens, Rick Scott and Noem with 0%
- ^ Mitt Romney and John Bolton with 2%; Cotton and Kasich with 1%; Owens, Rick Scott and Noem with 0%
- ^ Mitt Romney with 3%; Cotton, Christie and Noem with 1%; Hawley with 0%
- ^ Cotton, Hawley and Noem with 1%; Rick Scott, Stefanik and Christie with 0%
- ^ Mitt Romney with 4%; John Bolton with 2%; Cotton and Kasich with 1%; Owens, Rick Scott and Noem with 0%
- ^ Christie with 2%
- ^ Christie with 1%
- ^ Noem and Christie with 1%; Cotton, Hawley and Rick Scott with 0%
- ^ Mitt Romney with 2%; Christie with 1%; Cotton, Noem and Rick Scott with 0%
- ^ Chris Christie with 2%; Rick Scott with 1%; Hawley, Stefanik, Cotton, Sasse and Noem with 0%
- ^ Chris Christie with 1%
- ^ Romney with 2%; Kristi Noem with 1%; Christie, Cotton, Hawley and Rick Scott with 0%
- ^ Romney, Noem and Christie with 1%; Cotton, Hawley and Rick Scott with 0%
- ^ Mitt Romney with 2%; Cotton, Christie with 1%; Hawley and Rick Scott with 0%
- ^ Mitt Romney with 2%; Cotton, Christie with 1%; Hawley and Rick Scott with 0%
- ^ Mitt Romney with 4%; Candace Owens with 3%; Cotton, Kasich with 1%; Bolton with 0%
- ^ Josh Hawley with 2%; Christie, Stefanik with 1%, Cotton, Sasse, Rick Scott, Noem with 0%
- ^ Calculated by taking the difference of 100% and all other candidates combined.
- ^ Marco Rubio with 3%; Mike Pompeo with 2%; Tim Scott with 1%; and "Someone else" with 7%
- ^ "Someone else" with 4%; Greg Abbott with 2%
- ^ Glenn Youngkin with 1%, Tucker Carlson with 3%
- ^ Tucker Carlson, Josh Hawley, Tom Cotton, and Kristi Noem with 1%
- ^ a b c d e f g h i j k l m n o p q r s t u Standard VI response
- ^ Candace Owens with 3%; Greg Abbott, Liz Cheney, Tom Cotton, John Kasich, Kristi Noem and Rick Scott with 1%
- ^ Liz Cheney with 2%; Tom Cotton, Kristi Noem and Rick Scott with 1%
- ^ Chris Christie with 7%; Kristi Noem with 3%, Josh Hawley with 1%
- ^ Liz Cheney and John Kasich with 2%; Tom Cotton, Candace Owens and Rick Scott with 1%; Kristi Noem with 0%
- ^ "Someone else" with 5%; Josh Hawley with 1%, Tom Cotton with 0%
- ^ John Kasich, Kristi Noem and Candace Owens with 2%; Liz Cheney with 1%; Tom Cotton and Rick Scott with 0%
- ^ Tucker Carlson with 2%, Kristi Noem with 1%; Tom Cotton with 0%
- ^ Tom Cotton, Larry Hogan, and Kristi Noem with 1%; Chris Christie and Rick Scott with 0%
- ^ Candace Owens with 4%; Liz Cheney, Tom Cotton, John Kasich and Rick Scott with 1%; Kristi Noem with 0%
- ^ "Trump should not run again in 2024" as opposed to "Trump should run again in 2024" with 19%
- ^ 22% of a full sample of 1,316 adults
- ^ "Do not want Trump to run" as opposed to "want Trump to run" with 30%
- ^ Candace Owens with 3%; John Kasich, Liz Cheney, Tucker Carlson, Rick Scott, and Kristi Noem with 1%; Tom Cotton with 0%
- ^ Would not vote with 4%; "Someone else" with 2%; Liz Cheney and Kristi Noem with 1%; Rick Scott with 0%
- ^ "Trump should not run again in 2024" as opposed to "Trump should run again in 2024" with 22%
- ^ Republican subsample of total sample of 1574 likely voters
- ^ "Unlikely or very unlikely to vote for Trump" as opposed to "Absolute will or likely to vote for Trump" with 24%; Would not vote with 3%
- ^ "Consider voting for Trump" with 8%; Undecided with 4%
- ^ John Kasich with 3%; Candace Owens with 2%; Tom Cotton, Rick Scott with 1%; Kristi Noem with 0%
- ^ Kristi Noem with 1%
- ^ Tom Cotton, Josh Hawley, Larry Hogan, and Kristi Noem with 1%; Chris Christie and Rick Scott with 0%
- ^ On whether voters thought they'd support a Trump primary campaign if he ran
- ^ "Would definitely not vote for Trump" with 16%
- ^ Candace Owens with 3%; Tom Cotton and John Kasich with 2%; Kristi Noem, Tucker Carlson, and Tim Scott with 1%; Rick Scott with 0%
- ^ "Someone else" with 12%; Josh Hawley with 2%, Tom Cotton with 1%
- ^ Would not vote with 5%; "Someone else" with 3%; Tom Cotton, Josh Hawley, Larry Hogan, and Kristi Noem with 1%; Rick Scott with 0%
- ^ GOP and GOP-leaning subsample of a full sample of 1,006 registered voters
- ^ Among all adults (no Republican crosstab published). The same pollster showed 25% for Trump and 19% for Romney in November, when taking into account all voters and not only Republicans.[1]
- ^ Larry Hogan with 6%, Ben Sasse with 3%; Rick Scott with 2%; Josh Hawley, Ivanka Trump with 1%
- ^ Listed as "Skipped"
- ^ Would not vote with 6%; "Someone else" with 5%; Kristi Noem with 2%; Tom Cotton, Josh Hawley, and Rick Scott with 1%
- ^ Tucker Carlson with 3%, John Kasich and Kristi Noem with 2%; Tom Cotton with 1%; Rick Scott with 0%
- ^ "Would not like to see Trump run for president in 2024" with 21%
- ^ John Kasich with 3%; Tom Cotton, Kristi Noem, Tucker Carlson, and Rick Scott with 1%
- ^ Would not vote with 5%; "Someone else" with 3%; Kristi Noem, Josh Hawley, and Rick Scott with 1%; Charlie Baker with 0%
- ^ 37% of the full sample of 1,500 2020 general election voters
- ^ Ivanka Trump and Tucker Carlson with 2%; Tom Cotton, Josh Hawley and Ben Sasse with 1%
- ^ Among 304 republican adults as opposed to all adults
- ^ Tucker Carlson with 4%, John Kasich and Rick Scott with 2%; Rick Santorum with 1%
- ^ Republican subsample of 1,200 registered voters
- ^ Respondents who think Trump should do something other than running for president in 2024 with 43%
- ^ "Someone else" at 3%; Christie at 2%; Binkley, Burgum, Hutchinson and Johnson at 1%; Elder, Hurd, Stapleton and Suarez at 0%
- ^ Christie at 4%; Elder at 2%; Binkley, Burgum, Hutchinson, Johnson, Stapleton and Suarez at 1%; Hurd at 0%; Someone Else at 4%
- ^ Liz Cheney with 3%; Greg Abbott with 2%; Chris Christie, Tom Cotton, Dan Crenshaw, Brian Kemp, Kristi Noem, and Glenn Youngkin with 1%.
- ^ Greg Abbott, Liz Cheney, and Candance Owens with 2%; John Bolton, Tom Cotton, John Kasich, Kristi Noem, and Rick Scott with 1%.
- ^ "Someone Else" with 3%; Chris Christie with 2%; Greg Abbott, Liz Cheney, and Glenn Youngkin with 1%.
- ^ Greg Abbott with 3%; Liz Cheney, John Kasich, Kristi Noem, and Candance Owens with 2%; John Bolton, Tom Cotton, Richard Grenell, and Rick Scott with 1%.
- ^ Liz Cheney with 3%; Greg Abbott, Kristi Noem, Rick Scott, and Glenn Youngkin with 1%.
- ^ Chris Christie with 2%; Liz Cheney, Kristi Noem, and Glenn Youngkin with 1%.
- ^ Candance Owens with 4%; Greg Abbott with 2%; Liz Cheney, Tom Cotton, John Kasich, Kristi Noem, and Rick Scott with 1%.
- ^ Liz Cheney with 2%; Greg Abbott, Chris Christie, Tom Cotton, and Glenn Youngkin with 1%.
- ^ "Someone Else," with 6%; Glenn Youngkin with 4%; Greg Abbott with 3%.
- ^ "Someone Else," with 2%; Greg Abbott, Liz Cheney, Chris Christie, Kristi Noem, Rick Scott, and Marjorie Taylor Greene with 1%.
- ^ Greg Abbott and Candance Owens with 3%; John Bolton, Tom Cotton, Liz Cheney, Richard Grenell, John Kasich, and Rick Scott with 1%.
- ^ "Someone Else," Greg Abbott, Liz Cheney, and Tom Cotton with 1%.
- ^ Candance Owens with 3%; Greg Abbott with 2%; Tom Cotton and Kristi Noem with 1%.
- ^ Liz Cheney, Kristi Noem, and Rick Scott with 1%.
- ^ Liz Cheney and Tom Cotton with 2%; Greg Abbott, Chris Christie, Kristi Noem, Ben Sasse, Rick Scott, and Glenn Youngkin with 1%.
- ^ Candance Owens with 4%; Greg Abbott, Tom Cotton, John Kasich, and Kristi Noem with 2%; Liz Cheney and Rick Scott with 1%.
- ^ "Someone Else" with 14%; Liz Cheney, Chris Christie, and Kristi Noem with 1%.
- ^ Liz Cheney with 2%; Greg Abbott, Chris Christie, Tom Cotton, and Glenn Youngkin with 1%.
- ^ Candance Owens with 3%; Greg Abbot, Liz Cheney, Tom Cotton, and Kristi Noem with 1%.
- ^ Liz Cheney with 3%; Greg Abbott with 2%, Chris Christie and Kristi Noem with 1%.
- ^ Liz Cheney, Greg Abbott, Chris Christie, Glenn Youngkin, Rick Scott, and "Someone else" with 1%; Larry Hogan, Tom Cotton, Ben Sasse, and Kristi Noem with 0%.
- ^ Liz Cheney and Kristi Noem with 2%; "Someone else", Greg Abbott, Chris Christie and Tom Cotton with 1%; Josh Hawley, Larry Hogan, Ben Sasse and Rick Scott with 0%
- ^ Candace Owens with 5%; Greg Abbott, Liz Cheney, John Kasich, Kristi Noem and Rick Scott with 2%; Tom Cotton with 1%
- ^ "Someone else" with 3%; Liz Cheney, Chris Christie, Tom Cotton, Josh Hawley and Kristi Noem with 1%; Greg Abbott, Ben Sasse, Rick Scott and Marjorie Taylor Greene with 0%
- ^ Candace Owens with 5%; Liz Cheney and John Kasich with 2%; Tom Cotton, Kristi Noem and Rick Scott with 1%
- ^ "Someone else" with 8%; Tom Cotton with 1%
- ^ Candace Owens with 6%; Ivanka Trump with 5%; Kristi Noem with 2%; Liz Cheney, Tom Cotton and John Kasich with 1%; Rick Scott with 0%
- ^ No voters
- ^ "Someone else" with 1%; Greg Abbott, Liz Cheney, Tom Cotton, Josh Hawley and Kristi Noem with 1%; Chris Christie, Larry Hogan, Ben Sasse and Rick Scott with 0%
- ^ Kristi Noem with 2%; Tom Cotton and Rick Scott with 1%; Chris Christie with 0%
- ^ No voters
- ^ No voters
- ^ No voters
- ^ "Someone else" with 2%; Greg Abbott, Liz Cheney, Chris Christie, Kristi Noem and Rick Scott with 1%; Tom Cotton, Josh Hawley and Ben Sasse with 0%
- ^ Ivanka Trump with 4%; Candace Owens with 3%; Liz Cheney with 2%; Tom Cotton, John Kasich, Kristi Noem and Rick Scott with 1%
- ^ Candace Owens with 5%; Ivanka Trump with 3%; John Kasich with 2%; Liz Cheney, Tom Cotton, and Kristi Noem with 1%; Rick Scott with 0%
- ^ No voters
- ^ Liz Cheney with 3%; Greg Abbott, Tom Cotton, Kristi Noem, Ben Sasse and "Someone else" with 1%; Chris Christie and Rick Scott with 0%; Dave Portnoy with no voters
- ^ Republican subsample of total sample of 1574 likely voters
- ^ "Someone else" with 19%; Kristi Noem and Ben Sasse with 1%
- ^ No voters
- ^ No voters
- ^ Kristi Noem and "Someone else" with 1%; Greg Abbott, Dave Portnoy and Rick Scott with 0%; Tom Cotton and Ben Sasse with no voters
- ^ Candace Owens with 4%; Ivanka Trump with 3%; Tom Cotton, John Kasich with 2%; Rick Scott and Kristi Noem with 1%
- ^ Greg Abbott with 2%; "Someone else," Tom Cotton, Tim Scott, Kristi Noem, Ben Sasse, Rick Scott, Josh Hawley, and Dave Portnoy with 1% or less
- ^ Kristi Noem with 4%; Chris Christie, Tom Cotton and Rick Scott with 1%
- ^ Candace Owens with 4%; Ivanka Trump with 3%; Tom Cotton, John Kasich, Kristi Noem, and Tim Scott with 2%; Rick Scott with 1%
- ^ "Other" with 21%; Tom Cotton and Kristi Noem with 4%; Greg Abbott and Devin Nunes with 2%
- ^ "Someone else" with 16%; Tom Cotton with 3%
- ^ Dan Crenshaw, Kristi Noem, Ben Sasse and "Someone else" with 2%; Tom Cotton, John Kasich, Rand Paul with 1%; Greg Abbott, Dave Portnoy, and Elise Stefanik with 1% or less
- ^ GOP and GOP-leaning subsample of a full sample of 1,006 registered voters
- ^ Rand Paul with 3%; John Kasich and "Someone else" with 2%; Dan Crenshaw and Tom Cotton with 1%; Greg Abbott, Larry Hogan, Ben Sasse and Elise Stefanik with 0%
- ^ Among all adults (no Republican crosstab published). The same pollster showed 25% for Trump and 19% for Romney in November, when taking into account all voters and not only Republicans.[1]
- ^ Ben Sasse and Ivanka Trump with 3%; Rick Scott with 2%
- ^ Ivanka Trump with 4%; John Kasich with 3%; Tom Cotton, Kristi Noem with 2%; Rick Scott with 0%
- ^ Among 304 republican adults as opposed to all adults
- ^ Rick Santorum with 3%; John Kasich and Rick Scott with 2%
- ^ John Kasich with 2%; Tom Cotton, Kristi Noem and Rick Scott with 1%
- ^ "Someone else" with 3%; Tom Cotton, Dan Crenshaw, Lindsey Graham and John Kasich with 2%; Ben Sasse and Elise Stefanik with 0%
- ^ Paul Ryan with 4%; Ivanka Trump with 3%; Kevin McCarthy with 2%
- ^ Calculated by taking the difference of 100% and all other candidates combined.
- ^ "Someone else not listed" & "None of these candidates" with 2%; Doug Burgum with 1%; Ryan Binkley, Larry Elder, Will Hurd, Perry Johnson & Francis Suarez with 0%
- ^ Doug Burgum and Will Hurd with 1%; Francis Suarez and Perry Johnson with 0%; "Someone else" with 9%
- ^ Ryan Binkley, Doug Burgum, Francis Suarez, Larry Elder, Will Hurd, Perry Johnson, and "Someone Else not Listed" with 0%; "None of these Candidates" with 7%
- ^ Liz Cheney with 4%; Mike Pompeo and Glenn Youngkin with 1%; "Someone else" with 2%
- ^ Liz Cheney with 4%; Marco Rubio with 3%; Mike Pompeo, Chris Sununu, and Larry Hogan with 1%; Glenn Youngkin with 0%; "Someone else" with 1%; "None of these Candidates" with 9%
- ^ Liz Cheney with 5%; Ted Cruz with 3%; Mike Pompeo with 2%; Marco Rubio with 1%; Kristi Noem and Glenn Youngkin with 0%
- ^ Ted Cruz and Mitt Romney with 3%; Marco Rubio with 2%; Liz Cheney with 1%
- ^ Ted Cruz with 10%; Donald Trump Jr. with 8%; Mitt Romney with 4%; Marco Rubio with 2%; Liz Cheney with 1%
- ^ Calculated by taking the difference of 100% and all other candidates combined.
- ^ Burgum at 1%
- ^ Kristi Noem at 1%; Perry Johnson at 0% and Glenn Youngkin at 0%
- ^ Doug Burgum with 1%
- ^ "Someone else" with 4%; Glenn Youngkin with 1%; Doug Burgum, Will Hurd, Perry Johnson, Kristi Noem & "Would not vote" with 0%
- ^ Doug Burgum with 1.7%; Glenn Youngkin with <1%
- ^ Liz Cheney with 3%; Kristi Noem and "Someone else" with 2%
- ^ Doug Burgum and Chris Sununu with 1%
- ^ Liz Cheney with 7%; Kristi Noem with 2%; Chris Sununu with 1%
- ^ Liz Cheney with 4%; Kristi Noem, Chris Sununu with 1%; Perry Johnson and John Bolton with 0%
- ^ Liz Cheney with 4%; Kristi Noem and Mike Pompeo with 2%; Ted Cruz with 1%; Chris Sununu and Glenn Youngkin with 0%
- ^ Neither with 6%
- ^ Ted Cruz and Mike Pompeo with 2%; Marco Rubio and Larry Hogan with 1%; Tom Cotton, and Glenn Youngkin with 0%
- ^ Mike Pompeo with 4%; Ted Cruz with 3%; Marco Rubio with 2%; Larry Hogan with 1%; Tom Cotton and Glenn Youngkin with 0%
- ^ Calculated by taking the difference of 100% and all other candidates combined.
- ^ Other with 2%; Doug Burgum with <1%
- ^ "Someone else" with 1%; Doug Burgum with <1%
- ^ Elder with 0%
- ^ Someone else with 4%
- ^ Chris Sununu with 1%
- ^ Someone else with 2%; Mike Pompeo with 1%
- ^ Liz Cheney with 3%; Ted Cruz with 1%; Kristi Noem, Mike Pompeo, Chris Sununu with 0%
- ^ Mitt Romney with 5%; Marco Rubio with 3%; Ted Cruz with 2%
- ^ Marco Rubio with 12%; Rick Scott with 10%
- ^ Marco Rubio with 26%; Rick Scott with 18%
- ^ Calculated by taking the difference of 100% and all other candidates combined.
- ^ "Other" with 1%
- ^ Will Hurd with 0%
- ^ Will Hurd with 0%
- ^ Will Hurd and Francis Suarez with 0%
- ^ Francis Suarez with 1%; Will Hurd and Larry Elder with 0%
- ^ Will Hurd with 1%; Francis Suarez with 0%
- ^ Liz Cheney and Greg Abbott with 0%
- ^ Liz Cheney with 1%; Greg Abbott, Glenn Youngkin, and Kristi Noem with 0%
- ^ Brian Kemp with 7%
- ^ Liz Cheney and Glenn Youngkin with 1%; Greg Abbott, Mike Pompeo, and Kristi Noem with 0%
- ^ Liz Cheney with 2%; Mike Pompeo with 1%
- ^ Mike Pompeo, Liz Cheney, and Glenn Youngkin with 1%; Greg Abbott and Kristi Noem with 0%
- ^ Greg Abbott, Ted Cruz, Liz Cheney, and Glenn Youngkin with 1%; Mike Pompeo and Kristi Noem with 0%
- ^ Ted Cruz and Liz Cheney with 2%; and Mike Pompeo and Kristi Noem with 1%; Greg Abbott and Glenn Youngkin with 0%
- ^ Ted Cruz, Liz Cheney, and Mike Pompeo with 1%; Kristi Noem, Greg Abbott, and Glenn Youngkin with 0%
- ^ Liz Cheney with 8%; Ted Cruz with 5%; Marco Rubio with 2%; Mike Pompeo with 1%
- ^ Ted Cruz with 6%; Kristi Noem and Mike Pompeo with 2%
- ^ Ted Cruz with 9%; Mike Pompeo with 4%; Kristi Noem with 2%
- ^ Likely Republican primary voter subsample of 1,093 likely general election voters
- ^ "Would vote for anyone other than Trump" with 14%; would not vote with 4%
- ^ Ted Cruz with 5%; Marco Rubio with 3%; Mitt Romney with 2%; "Other" with 2%
- ^ Ted Cruz with 15%; Mitt Romney with 6%; Marco Rubio with 3%; "Other" with 7%
- ^ Doug Burgum and Asa Hutchinson with 1%; "Another candidate" with 0%
- ^ Doug Burgum with 3%; Asa Hutchinson with 1%; "Another candidate" with 4%
- ^ Ted Cruz with 4%; Marco Rubio with 1%; Josh Hawley with 0%
- ^ Mike Pompeo with 1%
- ^ Calculated by taking the difference of 100% and all other candidates combined.
- ^ Chris Christie 3.0%
Ryan Binkley 1.5% - ^ Ryan Binkley with 1%; "None of these" with 2%
- ^ Ryan Binkley and David Stuckenberg with 0%
- ^ Ryan Binkley with 0%; "None of these" with 2%
- ^ "Someone else" with 2%
- ^ Ryan Binkley with 0%
- ^ The other percentages in this result were increased by redistributing Pence's supporters to their second-choice candidates in the poll
- ^ "Someone else" with 2%; Ryan Binkley with 0%
- ^ Perry Johnson with 1%
- ^ Ryan Binkley with 2%; Will Hurd and Perry Johnson with 0%
- ^ Will Hurd with 0%
- ^ Perry Johnson & Will Hurd with <1%
- ^ Perry Johnson with 1%; Ryan Binkley with and Will Hurd with 0%
- ^ Ryan Binkley, Perry Johnson and "Other" with 1%; Asa Hutchinson and "None of the above" with <0.5%
- ^ Ryan Binkley with 1% and Will Hurd with 0%
- ^ Francis Suarez with 0%
- ^ Perry Johnson and Will Hurd with <1%; Francis Suarez with 0%
- ^ Standard VI response
- ^ "Someone else" with 2%; Ryan Binkley with 1%; Will Hurd, Perry Johnson, Corey Stapleton and Francis Suarez with 0%
- ^ If Trump did not run in the caucuses
- ^ "Someone else" with 3%; Ryan Binkley with 1%; Will Hurd, Perry Johnson, Corey Stapleton and Francis Suarez with 0%
- ^ "Someone else" with 2%; Will Hurd with 1%; Ryan Binkley and Francis Suarez with <1%
- ^ Will Hurd with 1%
- ^ Ryan Binkley and Perry Johnson with 1%; Will Hurd and Francis Suarez with 0%
- ^ "Someone else" with <1%; Will Hurd with <1%; Francis Suarez with 0%
- ^ "Someone else" with 1%; Francis Suarez with 0%
- ^ Franciz Suarez at 1%; Will Hurd at less than 1%
- ^ Francis Saurez with 0%
- ^ Someone else with 3%
- ^ Greg Abbott with 2%; Liz Cheney and Kristi Noem with 1%
- ^ Mitt Romney with 3%; Rick Perry, Chris Sununu, Perry Johnson, Francis Suarez with 0%
- ^ Someone else with 2%
- ^ Mitt Romney with 4%, Liz Cheney with 1%, Chris Sununu, John Bolton and Glenn Youngkin with 0%
- ^ Greg Abbott, Liz Cheney and Kristi Noem with 1%; Greg Abbott, Mike Pompeo with 0%
- ^ Perry Johnson with 1%
- ^ Perry Johnson with 4%
- ^ Kristi Noem with 2%; Mike Pompeo with 1%
- ^ Mike Pompeo with 3%; Glenn Youngkin with 1%; "Someone else" with 6%
- ^ Kristi Noem and Mike Pompeo with 1%; Greg Abbott, Liz Cheney and Glenn Youngkin with 0%
- ^ Liz Cheney and Ted Cruz with 3%; Kristi Noem and Mike Pompeo with 1%
- ^ Ted Cruz with 3%; Greg Abbott, Kristi Noem and Mike Pompeo with 1%, Liz Cheney with 0%
- ^ Kristi Noem with 3%; Ted Cruz with 2%; Greg Abbott, Liz Cheney and Mike Pompeo with 1%, Glenn Youngkin with 0%
- ^ Kim Reynolds, Kristi Noem, Ted Cruz, and Marco Rubio with 1%
- ^ Mitt Romney with 5%; Ted Cruz with 4%; Kristi Noem and Mike Pompeo with 2%
- ^ Ted Cruz with 16%; Mitt Romney with 5%; Kristi Noem and Mike Pompeo with 6%
- ^ Mike Pompeo with 9%
- ^ Chris Sununu with 0%; "Someone else" with 3%
- ^ Kristi Noem with 1%; "Someone else" with 5%
- ^ Doug Burgum and Nikki Haley with 0%
- ^ Ted Cruz with 12%; Donald Trump Jr. with 11%; Ivanka Trump with 7%; Marco Rubio with 6%
- ^ Mike Pompeo with 2%
- ^ Calculated by taking the difference of 100% and all other candidates combined.
- ^ a b Key:
A – all adults
RV – registered voters
LV – likely voters
V – unclear - ^ "Someone else" with 4%; Doug Burgum with 3%; Vivek Ramaswamy with 2%; Chris Christie with 1%
- ^ Liz Cheney with 3%; "Someone else" with 5%
- ^ Mike Pompeo with 3%; "Someone else" with 8%
- ^ Calculated by taking the difference of 100% and all other candidates combined.
- ^ Francis Suarez with 0%
- ^ Liz Cheney with 1%; Greg Abbott and Kristi Noem with 0%
- ^ Liz Cheney with 3%; Glenn Youngkin, Greg Abbott, and Kristi Noem with 0%
- ^ Liz Cheney with 3%; Mike Pompeo and Glenn Youngkin with 1%; Greg Abbott and Kristi Noem with 0%
- ^ Liz Cheney with 3%; Greg Abbott and Mike Pompeo with 1%; Kristi Noem and Glenn Youngkin with 0%
- ^ Liz Cheney with 3%; Greg Abbott, Kristi Noem, and Mike Pompeo with 1%; Ted Cruz and Glenn Youngkin with 0%
- ^ Liz Cheney with 3%; Mike Pompeo and Ted Cruz with 1%; Kristi Noem, Greg Abbott, and Glenn Youngkin with 0%
- ^ Ted Cruz with 3%; Liz Cheney with 2%; Mike Pompeo and Kristi Noem with 1%; Greg Abbott and Glenn Youngkin with 0%
- ^ "Someone else" with 3%
- ^ Josh Hawley with 7%
- ^ Josh Hawley with 6%; "Someone else" with 17%
- ^ Josh Hawley with 29%; Ivanka Trump with 13%
- ^ "Doug Burgum & Asa Hutchinson with 1%; Larry Elder with 0%
- ^ "Someone else" with 2%; Doug Burgum with 1%; Larry Elder, Asa Hutchinson & Francis Suarez with 0%
- ^ Calculated by taking the difference of 100% and all other candidates combined.
- ^ Ron DeSantis 10.5%
Vivek Ramaswamy 5.0%
Chris Christie 3.0% - ^ Ryan Binkley with 0%
- ^ "Someone else" with 2%; Doug Burgum & Larry Elder with 1%; Will Hurd & Perry Johnson with 0%
- ^ Other, undecided, and refused
- ^ Chris Sununu with 0%
- ^ Ted Cruz with 5%; Mike Pompeo and Marco Rubio with 1%; Larry Hogan with 0%
- ^ Calculated by taking the difference of 100% and all other candidates combined.
- ^ Ron DeSantis 7.3%
- ^ "Another candidate" with 0%
- ^ Larry Elder & Will Hurd with 0%
- ^ Larry Elder, Will Hurd & Perry Johnson with 0%
- ^ Perry Johnson with 1%; Ryan Binkley, Larry Elder & Will Hurd with 0%
- ^ Will Hurd with 1%; Larry Elder & "Other" with 0%
- ^ Larry Elder and Will Hurd with 1%; Refused 1%
- ^ Larry Elder and Will Hurd with 1%; Perry Johnson with <1%; Francis Suarez with 0%
- ^ Will Hurd with 3%; Ryan Binkley, Larry Elder, and Francis Suarez with 0%
- ^ Perry Johnson with 2%; Will Hurd with 1%
- ^ "Someone else" with 3%
- ^ "Someone else" with 2%; Francis Suarez with 1%; Larry Elder with 0%
- ^ Will Hurd with 1%; Francis Suarez with 0%
- ^ Calculated by subtracting the candidates' percentages from 100; the source does not give a number
- ^ Suarez with 0%
- ^ Undecided, Other & Refused
- ^ Chris Sununu with 17%; "Undecided, Other & Refused" with 15%
- ^ Chris Sununu with 12%; Liz Cheney with 4%; Mike Pompeo with 2%; Kristi Noem with 1%; John Bolton and Marco Rubio with 0%; "Other" with 1%
- ^ Chris Sununu with 10%; Liz Cheney with 4%; Mike Pompeo and Glenn Youngkin with 1%; "Someone else" with 1%
- ^ Chris Sununu with 14%; Liz Cheney with 2%; Mike Pompeo with 1%; Kristy Noem with 0%; Other with 2%.
- ^ Chris Sununu with 7%; Mike Pompeo with 2%; Larry Hogan with 1%; Kristi Noem with 1%; "Someone else" with 3%
- ^ Chris Sununu with 13%; Glenn Youngkin with 0%
- ^ Liz Cheney, Chris Sununu and Larry Hogan with 4%; Kristi Noem with 2%; Ted Cruz and Marco Rubio with 1%; Mike Pompeo and Glenn Youngkin with 0%
- ^ Liz Cheney with 4%; Ted Cruz and Mike Pompeo with 1%; Larry Hogan with 0%
- ^ Chris Sununu, Rand Paul and Mike Pompeo with 1%
- ^ Ted Cruz, Kristi Noem, and Mike Pompeo with 1%; Rick Scott with 0%; "Other" with 3%
- ^ Tom Cotton and Ted Cruz with 2%; Kristi Noem with 1%; Mike Pompeo with 0%; "Other" with 9%
- ^ Ted Cruz and Kristi Noem with 2%; Tom Cotton and Mike Pompeo with 0%; "Other" with 9%
- ^ Ted Cruz, Kristi Noem and Marco Rubio with 2%; Mitt Romney with 1%; Liz Cheney and John Kasich with 0%
- ^ Mitt Romney with 13%; Ted Cruz with 1%; Kristi Noem and Mike Pompeo with 0%
- ^ Mitt Romney with 15%; Ted Cruz with 10%; Mike Pompeo with 3%; Kristi Noem with 1%
- ^ Mitt Romney with 7%; Ted Cruz with 4%; Donald Trump Jr. with 3%; Tom Cotton and Marco Rubio with 2%; Tucker Carlson with 1%
- ^ Donald Trump Jr. with 14%; Ted Cruz with 10%; Mitt Romney with 8%; Tom Cotton with 6%; Tucker Carlson and Marco Rubio with 4%
- ^ Doug Burgum with 1%
- ^ Doug Burgum and Will Hurd with 0%
- ^ Doug Burgum with 1%; Will Hurd with 0%
- ^ Doug Burgum, Will Hurd, and Francis Suarez with 0%
- ^ Will Hurd with 1%; Doug Burgum and Francis Suarez with 0%
- ^ Liz Cheney with 1%; Doug Burgum, Will Hurd, and Kristi Noem with 0%
- ^ Liz Cheney with 2%; Kristi Noem with 1%; Greg Abbott and Glenn Youngkin with 0%
- ^ Liz Cheney with 3%; Greg Abbott, Kristi Noem, Mike Pompeo, and Glenn Youngkin with 1%
- ^ Liz Cheney with 3%; Greg Abbott, Kristi Noem, and Mike Pompeo with 1%; Glenn Youngkin with 0%
- ^ Liz Cheney with 2%; Greg Abbott, Ted Cruz, Kristi Noem, and Mike Pompeo with 1%; Glenn Youngkin with 0%
- ^ Liz Cheney with 3%; Ted Cruz and Kristi Noem with 2%; Mike Pompeo and Glenn Youngkin with 1%; Greg Abbott with 0%
- ^ Ted Cruz with 5%; Liz Cheney with 3%; Kristi Noem with 1%; Greg Abbott, Mike Pompeo and Glenn Youngkin with 0%
- ^ Calculated by taking the difference of 100% and all other candidates combined.
- ^ Ryan Binkley with 0%
- ^ Doug Burgum with 0%
- ^ "Someone else" with 2%; Ryan Binkley, Doug Burgum, Corey Stapleton with 0%
- ^ Doug Burgum and Will Hurd with 0%
- ^ Doug Burgum and Will Hurd with 0%
- ^ Ryan Binkley, Doug Burgum, Larry Elder, Will Hurd, Perry Johnson & "Someone else" with 1%; Corey Stapleton with 0%
- ^ Doug Burgum, Will Hurd, and Francis Suarez with 0%
- ^ Doug Burgum, Will Hurd and Francis Suarez with 0%
- ^ Liz Cheney with 1%; Greg Abbott, Doug Burgum, Will Hurd, Kristi Noem, and Francis Suarez with 0%
- ^ "Someone Else" with 2%
- ^ Liz Cheney with 2%; Greg Abbott with 1%; Kristi Noem and Glenn Youngkin with 0%
- ^ Liz Cheney with 2%; Kristi Noem and Mike Pompeo with 1%; Greg Abbott and Glenn Youngkin with 0%
- ^ Chris Sununu with 0%
- ^ Liz Cheney with 2%; Greg Abbott, Kristi Noem, Mike Pompeo and Glenn Youngkin with 0%
- ^ Liz Cheney with 2%; Ted Cruz with 1%; Greg Abbott, Kristi Noem, Mike Pompeo and Glenn Youngkin with 0%
- ^ Liz Cheney and Ted Cruz with 2%; Mike Pompeo with 1%; Greg Abbott, Kristi Noem, and Glenn Youngkin with 0%
- ^ Mike Pompeo with 2%
- ^ Liz Cheney with 3%; Ted Cruz with 2%; Greg Abbott, Kristi Noem, Mike Pompeo, and Glenn Youngkin with 0%
- ^ Marco Rubio with 5%; Ted Cruz and Liz Cheney with 3%; Mike Pompeo with 1%
- ^ Ted Cruz with 2%
- ^ Ted Cruz with 6%; Mike Pompeo with 2%; Kristi Noem with 1%
- ^ Ted Cruz with 11%; Mike Pompeo with 5%; Kristi Noem with 2%
- ^ Ted Cruz with 2%
- ^ Ted Cruz with 2%; Kristi Noem with 1%
- ^ Ted Cruz and Mitt Romney with 3%; Marco Rubio with 2%; "Someone else" with 5%
- ^ Ted Cruz and Mitt Romney with 9%; Marco Rubio with 3%; "Someone else" with 4%
- ^ Doug Burgum with 0%
- ^ Doug Burgum with 1%
- ^ a b Doug Burgum and Will Hurd with 0%
- ^ a b No voters
- ^ Some Other Candidate at 1%
- ^ Will Hurd with 1%; Doug Burgum and Francis Saurez with 0%
- ^ Doug Burgum, Will Hurd and Francis Suarez with 0%
- ^ Larry Elder, Will Hurd and Perry Johnson with 1%; Ryan Binkley, Doug Burgum and Francis Suarez with 0%
- ^ Greg Abbott, Doug Burgum, Liz Cheney, Will Hurd, Kristi Noem, and Francis Saurez with 0%
- ^ Liz Cheney with 2%; Kristi Noem with 1%; Greg Abbott with 0%
- ^ Liz Cheney with 2%; Mike Pompeo and Glenn Youngkin with 1%; Greg Abbott and Kristi Noem with 0%
- ^ Liz Cheney with 2%; Mike Pompeo with 1%; Greg Abbott, Kristi Noem, and Glenn Youngkin with 0%
- ^ Liz Cheney with 2%; Ted Cruz and Mike Pompeo with 1%; Greg Abbott, Kristi Noem, and Glenn Youngkin with 0%
- ^ Liz Cheney and Ted Cruz with 2%; Mike Pompeo with 1%; Greg Abbott, Kristi Noem, and Glenn Youngkin with 0%
- ^ Liz Cheney with 3%; Ted Cruz with 2%; Greg Abbott, Kristi Noem, Mike Pompeo, and Glenn Youngkin with 0%
- ^ Ted Cruz with 7%; Liz Cheney with 6%; Marco Rubio with 2%; Mike Pompeo with 1%
- ^ Doug Burgum with 0%
- ^ Will Hurd with 0%
- ^ Doug Burgum and Will Hurd with 0%
- ^ Will Hurd with 1%; Doug Burgum with 0%
- ^ Doug Burgum and Francis Suarez with 0%
- ^ Liz Cheney with 1%; Greg Abbott with 0%
- ^ Liz Cheney with 2%; Kristi Noem with 1%; Greg Abbott with 0%
- ^ Liz Cheney with 3%; Greg Abbott with 1%; Kristi Noem, Mike Pompeo, and Glenn Youngkin with 0%
- ^ Ted Cruz with 4%; Mike Pompeo with 2%; "Someone else" with 3%
- ^ Liz Cheney with 3%; Glenn Youngkin with 2%; Greg Abbott and Mike Pompeo with 1%; Kristi Noem with 0%
- ^ Liz Cheney with 3%; Ted Cruz with 2%; Greg Abbott and Mike Pompeo with 1%; Kristi Noem with 0%
- ^ Ted Cruz with 2%; Greg Abbott, Mike Pompeo, and Glenn Youngkin with 1%; Liz Cheney and Kristi Noem with 0%
- ^ Greg Abbott with 3%; Liz Cheney and Ted Cruz with 2%; Mike Pompeo with 0%
- ^ Mitt Romney with 4%; Ted Cruz with 2%; Marco Rubio, Mike Pompeo with 1%; "Other" with 3%
- ^ Ted Cruz with 7%; Donald Trump Jr. with 6%; Mitt Romney and Marco Rubio with 4%; Mike Pompeo with 2%; "Someone else" with 4%
- ^ "Someone else" & "Wouldn't vote" with 1%
- ^ Doug Burgum with 0%
- ^ Doug Burgum and Will Hurd with 0%
- ^ "Someone else" with 2%; Doug Burgum, Will Hurd & Francis Suarez with 0%
- ^ Doug Burgum, "Wouldn't vote" & "Refused" with 1%; Larry Elder, Will Hurd with 0%
- ^ Doug Burgum and Will Hurd with 0%
- ^ Doug Burgum, Will Hurd, and Francis Suarez with 0%
- ^ "Someone else" with 3%; Francis Suarez with 1%; Doug Burgum & Will Hurd with 0%
- ^ Francis Suarez with 1%; Doug Burgum, and Will Hurd with 0%
- ^ Liz Cheney with 1%; Greg Abbott, Doug Burgum, and Kristi Noem with 0%
- ^ Liz Cheney with 3%; Greg Abbott with 1%; Kristi Noem and Glenn Youngkin with 0%
- ^ Liz Cheney with 3%; Greg Abbott, Mike Pompeo, and Glenn Youngkin with 1%; Kristi Noem with 0%
- ^ Chris Sununu with 2%; Mike Pompeo with 0%; "Someone else" with 4%
- ^ Liz Cheney with 4%; Greg Abbott, Kristi Noem, Mike Pompeo, and Glenn Youngkin with 0%
- ^ Liz Cheney with 3%; Ted Cruz and Mike Pompeo with 2%; Greg Abbott with 1%; Kristi Noem and Glenn Youngkin with 0%
- ^ Ted Cruz with 2%; Mike Pompeo with 1%; Marco Rubio with 0%; "Someone else" with 24%
- ^ Liz Cheney with 4%; Ted Cruz with 2%; Greg Abbott, Kristi Noem, and Mike Pompeo with 1%; Glenn Youngkin with 0%
- ^ Liz Cheney with 4%; Ted Cruz with 3%; Greg Abbott with 1%; Kristi Noem, Mike Pompeo, and Glenn Youngkin with 0%
- ^ Liz Cheney with 6%; Ted Cruz, Marco Rubio with 2%; Mike Pompeo with 0%; "Someone else" with 12%
- ^ Calculated by taking the difference of 100% and all other candidates combined.
- ^ Listed as undecided and other
- ^ Listed as undecided/other
- ^ Someone Else with 1.5%; Refused with 0.6%
- ^ Perry Johnson & Someone Else with 0%; Larry Elder with no voters
- ^ a b Will Hurd with 0%
- ^ Will Hurd with 1%; Larry Elder & Perry Johnson with less than 0.5%
- ^ "Someone else" with 1%
- ^ Larry Elder, Will Hurd, Pery Johnson, Francis Suarez and Ryan Binkley with 0%
- ^ Francis Suarez with 0%
- ^ Larry Elder, Will Hurd, Francis Suarez, "Other" and "None of the above" with <0.5%
- ^ Liz Cheney with 1%; Greg Abbott, Will Hurd, and Kristi Noem with 0%
- ^ Liz Cheney with 1%; Greg Abbott, Kristi Noem, and Glenn Youngkin with 0%
- ^ Chris Sununu with 1%
- ^ Liz Cheney with 2%; Glenn Youngkin with 1%; Greg Abbott, Kristi Noem, and Mike Pompeo with 0%
- ^ Mike Pompeo with 1%
- ^ Mike Pompeo with 2%, Chris Sununu with 1% Glenn Youngkin with 0%; "Someone else" with 2%
- ^ Liz Cheney with 2%; Mike Pompeo with 1%; Greg Abbott, Kristi Noem, and Glenn Youngkin with 0%
- ^ Liz Cheney with 2%; Kristi Noem and Mike Pompeo with 1%; Ted Cruz with 1%
- ^ Liz Cheney and Ted Cruz with 1%; Greg Abbott, Kristi Noem, and Glenn Youngkin with 0%
- ^ Mike Pompeo with 9%
- ^ Mike Pompeo with 5%
- ^ Mike Pompeo with 2%
- ^ Mike Pompeo with 1%
- ^ Liz Cheney with 2%; Greg Abbott, Ted Cruz, Kristi Noem, and Mike Pompeo with 1%
- ^ "Would vote for anyone other than Trump" with 9%; would not vote with 2%
- ^ "Would consider voting for Trump" with 20%; Undecided with 6%
- ^ Will Hurd with 0%
- ^ a b Francis Suarez and Will Hurd with 0%
- ^ Liz Cheney with 1%; Greg Abbott, Will Hurd, and Kristi Noem with 0%
- ^ Liz Cheney with 2%; Greg Abbott with 1%; Kristi Noem and Glenn Youngkin with 0%
- ^ Liz Cheney with 2%; Greg Abbott, Mike Pompeo, and Glenn Youngkin with 1%; Kristi Noem with 0%
- ^ Liz Cheney with 3%; Kristi Noem and Mike Pompeo with 1%; Greg Abbott and Glenn Youngkin with 0%
- ^ Liz Cheney and Ted Cruz with 2%; Mike Pompeo with 1%; Greg Abbott, Kristi Noem, and Glenn Youngkin with 0%
- ^ Ted Cruz with 2%; Greg Abbott, Mike Pompeo, Liz Cheney, and Glenn Youngkin with 1%; Kristi Noem with 0%
- ^ Ted Cruz with 2%; Liz Cheney with 1%; Greg Abbott, Mike Pompeo, and Kristi Noem with 0%
- ^ "Anyone/Any of them" & "No one/None of them" with 1%; "Someone else" with 0%
- ^ Will Hurd with 0%
- ^ Will Hurd, "Someone else" & "Anyone" with 1%; "No one" with 0%
- ^ Will Hurd with 0%
- ^ Will Hurd with 2%
- ^ Will Hurd with 1%
- ^ Will Hurd with 3%
- ^ Will Hurd and Francis Suarez with 0%
- ^ Will Hurd with 3%
- ^ Greg Abbott with 2%; Liz Cheney, Kristi Noem, Will Hurd, and Francis Suarez with 0%
- ^ Greg Abbott with 6%; Liz Cheney with 1%; Kristi Noem and Glenn Youngkin with 0%
- ^ Ted Cruz with 4%
- ^ "Would not vote" with 2%
- ^ Ted Cruz with 4%
- ^ Greg Abbott with 7%; Liz Cheney with 2%; Kristi Noem, Mike Pompeo, and Glenn Youngkin with 0%
- ^ Ted Cruz with 3%; Mike Pompeo with 2%
- ^ Greg Abbott with 7%; Liz Cheney with 2%; Kristi Noem and Mike Pompeo with 1%; Glenn Youngkin with 0%
- ^ Ted Cruz with 4%; Mike Pompeo with 1%
- ^ Greg Abbott with 7%; Liz Cheney with 2%; Ted Cruz, Kristi Noem, and Mike Pompeo with 1%; Glenn Youngkin with 0%
- ^ Greg Abbott with 7%; Ted Cruz with 3%; Liz Cheney with 2%; Mike Pompeo with 1%; Kristi Noem & Glenn Youngkin with 0%
- ^ Greg Abbott with 7%; Ted Cruz with 4%; Liz Cheney with 3%; Mike Pompeo with 1%; Kristi Noem & Glenn Youngkin with 0%
- ^ Ted Cruz with 4%; Mike Pompeo with 2%
- ^ Ted Cruz with 3%; Mike Pompeo with 2%
- ^ Mike Pompeo with 1%
- ^ Greg Abbott with 4%; Ted Cruz with 3%
- ^ Greg Abbott with 4%; Ted Cruz with 3%
- ^ Ted Cruz with 12%; Greg Abbott with 8%; Glen Youngkin with 0%
- ^ Ted Cruz with 4%; Greg Abbott and Marco Rubio with 2%
- ^ Ted Cruz with 6%; Greg Abbott with 5%; Kristi Noem with 2%
- ^ Ted Cruz with 8%; Greg Abbott with 6%; Kristi Noem with 2%
- ^ Tim Scott with 2%
- ^ Glen Youngkin with 1%
- ^ Marco Rubio with 3%
- ^ a b Kristi Noem with 3%
- ^ "Another candidate" with 11%; Liz Cheney with 5%; Asa Hutchinson with 2%
- ^ "None of these candidates" with 7%; "Someone else not listed" with 3%; Larry Elder and Francis Suarez with 0%
- ^ Liz Cheney with 4%; "Another candidate" with 9%
- ^ Liz Cheney with 7%; Ted Cruz with 3%; Asa Hutchinson with 1%; and "Another candidate" with 5%
- ^ Liz Cheney with 11%; Ted Cruz with 4%; and "Another candidate" with 9%
- ^ Marco Rubio with 3%; Larry Hogan and Glenn Youngkin with 1%; Mike Pompeo, Chris Sununu and Asa Hutchinson with 0%
- ^ Liz Cheney with 9%; Ted Cruz with 3%
- ^ Liz Cheney with 6%; Ted Cruz with 3%; Marco Rubio with 2%; Glenn Youngkin at 1%; Kristi Noem, Mike Pompeo and Kanye West at 0%
- ^ Liz Cheney with 16%; Ted Cruz with 6%; Other with 8%
- ^ Mitt Romney with 20%; Ted Cruz with 3%; Liz Cheney and Marco Rubio with 1%
- ^ Mitt Romney with 21%; Ted Cruz with 8%; Liz Cheney with 2%; Marco Rubio with 1%
- ^ Will Hurd with 0%
- ^ Will Hurd with 0%
- ^ Will Hurd and Francis Suarez with 0%
- ^ "Someone else" with 6%
- ^ Francis Suarez with 0%
- ^ Liz Cheney, Kristi Noem, and Greg Abbott with 0%
- ^ Liz Cheney with 2%; Kristi Noem with 1%; Greg Abbott with 0%
- ^ Chris Sununu with 1%; "Someone else" with 2%
- ^ Liz Cheney with 2%; Kristi Noem, Greg Abbott and Mike Pompeo with 0%
- ^ Liz Cheney with 2%; Kristi Noem with 1%; Greg Abbott and Mike Pompeo with 0%
- ^ Liz Cheney with 1%; Ted Cruz, Kristi Noem, and Mike Pompeo with 0%
- ^ Larry Hogan with 5%; Mike Pompeo with 2%
- ^ Donald Trump Jr. with 3%; Ted Cruz with 2%; Marco Rubio with 1%
- ^ Ted Cruz and Liz Cheney with 1%; Greg Abbott, Kristi Noem, and Mike Pompeo with 0%
- ^ Ted Cruz with 2%; Greg Abbott, Liz Cheney, Kristi Noem with 1%; Mike Pompeo with 0%
- ^ Calculated by taking the difference of 100% and all other candidates combined.
- ^ Larry Elder with 0%
- ^ Will Hurd with 0%
- ^ Will Hurd with 0%
- ^ Will Hurd with 1%; Francis Suarez with 0%
- ^ Liz Cheney with 1%; Greg Abbott with 0%
- ^ Larry Elder with <0.5%
- ^ Liz Cheney with 3%; Kristi Noem with 1%; Glenn Youngkin with 0%
- ^ Liz Cheney with 4%; Mike Pompeo with 1%; Greg Abbott, Kristi Noem, and Glenn Youngkin with 0%
- ^ Liz Cheney with 2%; Mike Pompeo and Greg Abbott with 1%; Kristi Noem and Glenn Youngkin with 0%
- ^ Liz Cheney with 4%; Ted Cruz, Mike Pompeo, and Greg Abbott with 1%; Kristi Noem and Glenn Youngkin with 0%
- ^ Ted Cruz and Liz Cheney with 4%; Mike Pompeo and Greg Abbott with 1%; Kristi Noem and Glenn Youngkin with 0%
- ^ Ted Cruz with 4%; Liz Cheney with 3%; Kristi Noem with 1%; Mike Pompeo and Greg Abbott with 0%
- Partisan clients
- ^ Poll sponsored by Harvard University Center for American Political Studies
- ^ Poll commissioned by the Republican Main Street Partnership
- ^ Poll sponsored by Alabama Families for Great Schools
- ^ Poll sponsored by American Greatness, which supports Trump
- ^ a b Poll sponsored by Club for Growth Action
- ^ a b c d e Poll sponsored by Club for Growth
- ^ a b c d Poll sponsored by the Des Moines Register, NBC News & Mediacom Iowa
- ^ Poll sponsored by Fields of Freedom
- ^ a b Poll sponsored by the Make America Great Again Inc. (Super Pac)
- ^ Poll sponsored by And To The Republic, a non-profit with ties to DeSantis
- ^ Poll sponsored by Citizens Awareness Project
- ^ Poll sponsored by Make America Great Again Inc. super PAC, which supports Trump
- ^ Poll sponsored by American Free Enterprise Chamber of Commerce
- ^ Poll commissioned by Republican Main Street Partnership
- ^ a b c d Poll sponsored by American Greatness, which supports Trump
- ^ a b c Poll sponsored by Trump campaign
- ^ Poll sponsored by Never Back Down PAC, which supports DeSantis.
- ^ a b Poll sponsored by Courageous Conservatives PAC
- ^ Poll sponsored by the University of Massachusetts Amherst Department of Political Science & WCVB
- ^ Poll commissioned by MIRS
- ^ Poll sponsored by Trump's campaign
- ^ a b Poll sponsored by American Greatness PAC
- ^ Poll commissioned by Republican Main Street Partnership
- ^ a b c d Poll sponsored by American Greatness PAC, which supports Trump.
- ^ Poll sponsored by the Courageous Conservatives PAC
- ^ Poll sponsored by the John Bolton Super PAC
- ^ Poll conducted for the John Locke Foundation
- ^ Poll conducted for the North Carolina Chamber of Commerce
- ^ Poll sponsored by American Greatness, which supports Trump
- ^ Poll sponsored by the Beacon Center of Tennessee
- ^ a b Poll sponsored by the Texas Political Project at the University of Texas
- ^ a b c d e f g h i j k l m n o p q r s t u v Poll sponsored by Defend Texas Liberty PAC
- ^ a b Poll sponsored by the Republican Party of Texas
- ^ Poll sponsored by Never Back Down PAC, which supports DeSantis
References[edit]
- ^ a b "Leger's Weekly Survey" (PDF). Archived (PDF) from the original on February 9, 2021. Retrieved November 18, 2020.
- ^ Key:
A – all adults
RV – registered voters
LV – likely voters
V – unclear
External links[edit]
Category:2024 United States Republican presidential primaries
Republican Party