User:Wxtrackercody/2004 Atlantic hurricane season
| Wxtrackercody/2004 Atlantic hurricane season | |
|---|---|
 Season summary map | |
| Seasonal boundaries | |
| First system formed | July 31, 2004 |
| Last system dissipated | December 5, 2004 |
| Strongest storm | |
| Name | Ivan |
| • Maximum winds | 165 mph (270 km/h) |
| • Lowest pressure | 910 mbar (hPa; 26.87 inHg) |
| Seasonal statistics | |
| Total depressions | 16 |
| Total storms | yhgdgrkflfkpifc 15 |
| Hurricanes | 9 |
| Major hurricanes (Cat. 3+) | 6 |
| Total fatalities | 3257+ |
| Total damage | At least $52 billion (2004 USD) |
| Related article | |
Seasonal forecast
[edit]| Source | Date | Named storms |
Hurricanes | Major hurricanes |
Ref |
| Average (1950–2000) | 9.6 | 5.9 | 2.3 | [1] | |
| Record high activity | 28 | 15 | 8 | [2] | |
| Record low activity | 4 | 2† | 0† | [2] | |
| ––––––––––––––––––––––––––––––––––––––––––––––––––––––– | |||||
| CSU | December 5, 2003 | 13 | 7 | 3 | [1] |
| CSU | April 2, 2004 | 14 | 8 | 3 | [3] |
| NOAA | May 17, 2004 | 12–15 | 6–8 | 2–4 | [4] |
| CSU | May 28, 2004 | 14 | 8 | 3 | [5] |
| CSU | August 6, 2004 | 13 | 7 | 3 | [6] |
| CSU | September 3, 2004 | 16 | 8 | 5 | [7] |
| CSU | October 1, 2004 | 15 | 9 | 6 | [8] |
| ––––––––––––––––––––––––––––––––––––––––––––––––––––––– | |||||
| Actual activity |
15 | 9 | 6 | ||
| † Most recent of several such occurrences. (See all) | |||||
Pre-season forecasts
[edit]Mid-season outlooks
[edit]Seasonal summary
[edit]
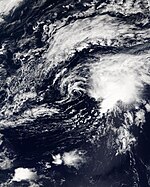
The 2004 Atlantic hurricane season featured a total of sixteen tropical cyclones; all but one further intensified to reach tropical or subtropical storm intensity. Of the fifteen named storms, nine intensified into hurricanes; six became major hurricanes, a Category 3 or higher on the Saffir–Simpson hurricane wind scale. Despite above-average activity, the year began unusually late. The tropical depression that eventually developed into Hurricane Alex was designated on July 31; only on two occasions since 1967 has a tropical cyclone formed after this date.[9] Unlike its predecessor, the month of August featured well above-average tropical cyclone activity, with a total of eight named storms being designated. This total surpassed activity in August 1933 and 1995, setting a new record for most tropical cyclone activity in the month.[10] The final cyclone of the season, Otto, formed on November 29 and lasted through the typical bounds of an Atlantic hurricane season. Overall, nine tropical cyclones impacted the United States during 2004: six hurricanes and three tropical storms.
Storms
[edit]Hurricane Alex
[edit]| Category 3 hurricane (SSHWS) | |
| Duration | July 31 – August 6 |
|---|---|
| Peak intensity | 120 mph (195 km/h) (1-min); 957 mbar (hPa) |
Tropical Storm Bonnie
[edit]| Tropical storm (SSHWS) | |
| Duration | August 3 – August 13 |
|---|---|
| Peak intensity | 65 mph (100 km/h) (1-min); 1001 mbar (hPa) |
Hurricane Charley
[edit]| Category 4 hurricane (SSHWS) | |
| Duration | August 9 – August 14 |
|---|---|
| Peak intensity | 150 mph (240 km/h) (1-min); 941 mbar (hPa) |
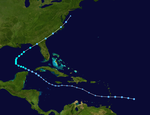
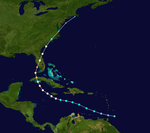
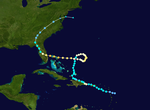
On August 4, a tropical wave emerged off the western coast of Africa. Tracking rapidly westward across the Atlantic, the wave steadily organized as banding features and cyclonic turning became increasingly evident on satellite. Following surface observations from the southern Windward Islands, advisories were initiated on a tropical depression at 1200 UTC on August 9. Over the course of the next day, the depression entered the eastern Caribbean Sea and began to turn west-northwest in response to high pressure to the cyclone's north. At 0600 UTC on August 10, the depression intensified into Tropical Storm Charley. In an environment of low wind shear, and with outflow established aloft, the newly named tropical storm continued to intensify, reaching Category 1 hurricane status at 1800 UTC the next day, while located south of Jamaica.
Upon reaching the western periphery of the high to its north, Charley turned towards the northwest. The system passed just northeast of Grand Cayman early on August 12 while subsequently intensifying into a Category 2 hurricane. By 0430 UTC the following morning, Charley intensified into a Category 3 hurricane and made its first landfall near Playa del Cajio, Cuba.
Hurricane Danielle
[edit]| Category 2 hurricane (SSHWS) | |
| Duration | August 13 – August 21 |
|---|---|
| Peak intensity | 110 mph (175 km/h) (1-min); 964 mbar (hPa) |
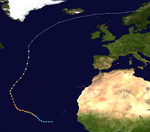
A vigorous tropical wave emerged off the western coast of Africa on August 12 and quickly organized into a tropical depression while positioned approximately 520 mi (835 km) southeast of the Cape Verde Islands the following day. Owing to favorable environmental conditions, an increase in spiral banding and deep convection over the center prompted the National Hurricane Center to upgrade the system to a tropical storm at 0000 UTC on August 14. A period of rapid deepening began shortly thereafter as Danielle turned northwest; at 0000 UTC the following day, the cyclone was upgraded to a Category 1 hurricane roughly 340 mi (545 km) west-southwest of the southernmost Cape Verde Islands. After intensifying into a Category 2 hurricane at 1800 UTC, a slower rate of intensification brought the cyclone to its peak intensity with maximum sustained winds of 110 mph (175 km/h) and a minimum barometric pressure of 964 mb (hPa; 28.47 inHg) a day later. Curving to the north in advance of an upper-level trough, increasing wind shear caused Danielle to begin a steadily weakening trend. At 0000 UTC on August 18, it weakened to a Category 1 hurricane, and by 1200 UTC the same day Danielle was downgraded to a tropical storm. At 1800 UTC on August 21, Danielle degenerated into a remnant low several hundred miles southwest of the Azores, though its circulation persisted over the following three days.[11]
Tropical Storm Earl
[edit]| Tropical storm (SSHWS) | |
| Duration | August 13 – August 15 |
|---|---|
| Peak intensity | 50 mph (85 km/h) (1-min); 1009 mbar (hPa) |
A tropical wave emerged off the western coast of Africa on August 10. Tracking westward, it developed into a tropical depression about 1,150 mi (1,850 km) east of the Lesser Antilles on the afternoon of August 13. Embedded within a deep easterly flow, the newly formed depression raced toward the west and intensified into Tropical Storm Earl at 1800 UTC on August 14. Following a substantial increase in convection over the center, the system attained its peak intensity with winds of 50 mph (85 km/h) and a barometric pressure of 1009 mb (hPa; 29.80 inHg) early on August 15. Despite a well-organized appearance on satellite imagery, a reconnaissance aircraft that same day reported that the low-level circulation was not well-defined, likely due to the storm's quick motion. At 0000 UTC on August 16, Earl degenerated into an open tropical wave over the eastern Caribbean Sea; the remnants of the system continued westward and eventually led to the formation of Hurricane Frank in the eastern Pacific by August 23.[12]
As a tropical cyclone, Earl produced moderate damage throughout the southern Leeward Islands. Across Grenada and surrounding locations, winds just shy of tropical storm-force ripped the roofs off many homes and downed power poles in addition to trees. Heavy rainfall led to sporadic rockslides and mudslides.[13] At the height of the storm, winds left 90% of the island of Tobago without electricity.[14] Overall, the system killed 1 with an additional 19 left missing.[15]
Hurricane Frances
[edit]| Category 4 hurricane (SSHWS) | |
| Duration | August 25 – September 8 |
|---|---|
| Peak intensity | 145 mph (230 km/h) (1-min); 935 mbar (hPa) |
Hurricane Gaston
[edit]| Category 1 hurricane (SSHWS) | |
| Duration | August 27 – September 1 |
|---|---|
| Peak intensity | 75 mph (120 km/h) (1-min); 985 mbar (hPa) |
Tropical Storm Hermine
[edit]| Tropical storm (SSHWS) | |
| Duration | August 27 – August 31 |
|---|---|
| Peak intensity | 60 mph (95 km/h) (1-min); 1002 mbar (hPa) |
In late August, a frontal boundary stalled out across the subtropical Atlantic. By August 25, shower and thunderstorm activity began to increase south of Bermuda and steadily detach from the front. This activity began to show signs of cyclonic rotation the following day, and a weak surface low formed on August 27. Despite northerly wind shear, the system acquired enough organization to be considered a tropical depression by 1800 UTC that day. Tracking west-northwest around the western periphery of a subtropical ridge, the system intensified into Tropical Storm Hermine at 1200 UTC on August 29. In conjunction with satellite intensity estimates, the storm is estimated to have reached its peak intensity with winds of 60 mph (95 km/h) and a minimum pressure of 1002 mb (hPa; 29.59 inHg) at 0600 UTC on August 30. Thereafter, unfavorable upper-level winds from the outflow associated with Hurricane Gaston caused the system to begin weakening, with its center becoming exposed to view. At 0600 UTC, Hermine made landfall as a minimal tropical storm near New Bedford, Massachusetts. The cyclone transitioned into an extratropical cyclone a few hours later before being absorbed into a cold front by 1800 UTC.[16]
Wind gusts up to tropical storm-force and heavy rainbands affected eastern portions of Massachusetts as the storm moved ashore; despite this, measurable precipitation was generally less than 0.5 in (12.5 mm). Convective activity from a weakening Tropical Storm Gaston overspread the region shortly thereafter, making it difficult to separate totals between the two cyclones.[16] As an extratropical cyclone, Hermine produced rainfall totals generally between 1.5–2.0 in (40–55 mm) across New Brunswick; minor basement flooding and street closures were reported in Moncton as a result. A total of 2.3 in (60 mm) was reported across the province. On Prince Edward Island and in Nova Scotia, maximum rainfall totals reached 2.8 in (73.5 mm) and 1.8 in (47 mm), respectively. In Newfoundland, a maximum total of 1.9 in (50 mm) was reported. No winds to gale-force were reported across the region.[17]
Hurricane Ivan
[edit]| Category 5 hurricane (SSHWS) | |
| Duration | September 2 – September 24 |
|---|---|
| Peak intensity | 165 mph (270 km/h) (1-min); 910 mbar (hPa) |
Tropical Depression Ten
[edit]| Tropical depression (SSHWS) | |
| Duration | September 7 – September 9 |
|---|---|
| Peak intensity | 35 mph (55 km/h) (1-min); 1009 mbar (hPa) |
A tropical wave accompanied with a well-organized area of convection emerged off the western coast of Africa on August 29. Performing a slow curve over the eastern Atlantic, the wave became increasingly less-defined over subsequent days as a result of strong southwesterly wind shear. Following the development of shower and thunderstorm activity near the center, the system acquired enough organization to be deemed a tropical depression at 1200 UTC on September 7, while positioned about 725 mi (1,165 km) southwest of the southernmost Azores. Credited to a continued hostile environment, the depression did not intensify into a tropical storm and instead degenerated into a remnant low by 1200 UTC on September 9 after the center decoupled from the remainder of the convective activity. The low-level circulation persisted near the Azores until dissipating the following day.[18]
Hurricane Jeanne
[edit]| Category 3 hurricane (SSHWS) | |
| Duration | September 13 – September 28 |
|---|---|
| Peak intensity | 120 mph (195 km/h) (1-min); 950 mbar (hPa) |
Hurricane Karl
[edit]| Category 4 hurricane (SSHWS) | |
| Duration | September 16 – September 24 |
|---|---|
| Peak intensity | 145 mph (230 km/h) (1-min); 938 mbar (hPa) |
Hurricane Lisa
[edit]| Category 1 hurricane (SSHWS) | |
| Duration | September 19 – October 3 |
|---|---|
| Peak intensity | 75 mph (120 km/h) (1-min); 987 mbar (hPa) |
Tropical Storm Matthew
[edit]| Tropical storm (SSHWS) | |
| Duration | October 8 – October 10 |
|---|---|
| Peak intensity | 45 mph (75 km/h) (1-min); 997 mbar (hPa) |
Subtropical Storm Nicole
[edit]| Subtropical storm (SSHWS) | |
| Duration | October 10 – October 11 |
|---|---|
| Peak intensity | 50 mph (85 km/h) (1-min); 986 mbar (hPa) |
Tropical Storm Otto
[edit]| Tropical storm (SSHWS) | |
| Duration | November 29 – December 3 |
|---|---|
| Peak intensity | 50 mph (85 km/h) (1-min); 995 mbar (hPa) |
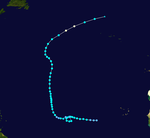
On November 21, a cold front moved off the East Coast and stalled about midway between Bermuda and the Azores three days later. A strong upper-level trough across the northern Atlantic dug southward, promoting the development of an extratropical surface low along the front about 1,150 mi (1,850 km) southwest of the Azores by 0000 UTC on November 6. Within a region of strong baroclinity, the low rapidly deepened and transitioned into a large gale area later that day. High pressure built overhead, leading to the development of convective banding shortly thereafter. The system gained enough organization to be declared a subtropical storm by 1200 UTC the next day, while centered 1,150 mi (1,850 km) east-southeast of Bermuda. A few hours later, it attained peak winds of 50 mph (85 km/h). In response to a weakness in the ridge to the cyclone's north, Otto drifted northwestward while simultaneously acquiring a warm core; by 1200 UTC on November 30, it transitioned into a fully tropical storm.
Following the system's transition into a tropical storm, Otto tracked across sea surface temperatures of 21–23 °C (70–73 °F) and within a region of light wind shear between two upper-level lows. The marginally favorable environment allowed for convective sustainability initially, but an increase in wind sheared caused the system to degrade in organization. At 1200 UTC on December 2, Otto weakened to a tropical depression while simultaneously attaining its lowest pressure of 995 mb (hPa; 29.39 inHg). Turning southeastward due to a developing ridge over the East Coast of the United States, organization continued to degrade as convection became displaced southeast of the center. After entraining mid-level dry air, the remainder of the shower and thunderstorm activity dissipated, and Otto degenerated into a remnant low by 0600 UTC on December 3, while centered 920 mi (1,480 km) southeast of Bermuda. The broad circulation drifted southward and eventually southwestward before dissipating well northeast of the Leeward Islands early on December 5.[19]
Storm names
[edit]The following names were used for named storms that formed in the Atlantic basin in 2004. The names not retired from this list will be used again in the 2010 season. This is the same list used for the 1998 season except for Gaston and Matthew, which replaced Georges and Mitch. Storms were named Gaston, Matthew, and Otto for the first time in 2004. Names that were not assigned are marked in gray.
|
Season effects
[edit]The following table lists all of the storms that have formed in the 2004 Atlantic hurricane season. It includes their duration, names, landfall(s) (in parentheses), damages, and death totals. Deaths in parentheses are additional and indirect (an example of an indirect death would be a traffic accident), but were still related to that storm. Damage and deaths include totals while the storm was extratropical, a wave, or a low, and all of the damage figures are in 2013 USD.
| Saffir–Simpson scale | ||||||
| TD | TS | C1 | C2 | C3 | C4 | C5 |
| Storm name |
Dates active | Storm category at peak intensity |
Max 1-min wind mph (km/h) |
Min. press. (mbar) |
Areas affected | Damage (USD) |
Deaths | Ref(s) | ||
|---|---|---|---|---|---|---|---|---|---|---|
| Alex | July 31 – August 6 | Category 3 hurricane | 120 (195) | 957 | North Carolina | 7.5 | 1 | |||
| Bonnie | August 3 – August 14 | Tropical storm | 65 (100) | 1001 | Southeastern United States | 1.27 | 4 | |||
| Charley | August 9 – August 15 | Category 4 hurricane | 145 (230) | 941 | Cuba, Southeastern United States | 16300 | 35 | |||
| Danielle | August 13 – August 21 | Category 2 hurricane | 110 (175) | 964 | None | None | None | |||
| Earl | August 13 – August 15 | Tropical storm | 50 (85) | 1009 | Windward Islands | Minimal | 1 | |||
| Frances | August 25 – September 8 | Category 4 hurricane | 145 (230) | 935 | Bahamas, Southeastern United States | 9600 | 49 | |||
| Gaston | August 27 – September 1 | Category 1 hurricane | 75 (120) | 986 | Mid-Atlantic states | 130.0 | 9 | |||
| Hermine | August 27 – August 31 | Tropical storm | 60 (95) | 1002 | New England, New Brunswick, Newfoundland, Nova Scotia | Minimal | None | |||
| Ivan | September 2 – September 24 | Category 5 hurricane | 165 (265) | 910 | Windward Islands, Jamaica, Cuba, Southeastern United States | 17200 | 123 | |||
| Ten | September 7 – September 9 | Tropical depression | 35 (55) | 1009 | None | None | None | |||
| Jeanne | September 13 – September 28 | Category 3 hurricane | 120 (195) | 950 | Leeward Islands, Greater Antilles, Southeastern United States | 7000 | ≥3,035 | |||
| Karl | September 16 – September 24 | Category 4 hurricane | 145 (230) | 938 | Faroe Islands, Norway | None | None | |||
| Lisa | August 27 – August 31 | Tropical storm | 75 (120) | 987 | None | Minimal | None | |||
| Matthew | October 8 – October 10 | Tropical storm | 45 (75) | 997 | Southeastern United States, Ohio River Valley | 0.0305 | None | |||
| Nicole | October 10 – October 11 | Subtropical storm | 50 (85) | 986 | Bermuda, Atlantic Canada | Minimal | None | |||
| Otto | November 29 – December 5 | Tropical storm | 50 (85) | 995 | None | None | None | |||
| Season aggregates | ||||||||||
| 16 systems | July 31 – December 5 | 165 (265) | 910 | ≥52000 | ≥3,257 | |||||
Retirement
[edit]The World Meteorological Organization retired four names in the spring of 2005: Charley, Frances, Ivan, and Jeanne. They were replaced in the 2010 season by Colin, Fiona, Igor, and Julia. The 2004 season was tied with the 1955 season and1995 season for the most storm names retired after a single season until the preceding year, when five names were retired.
See also
[edit]- 2004 Pacific hurricane season
- 2004 North Indian Ocean cyclone season
- 2004 Pacific typhoon season
- Australian region cyclone seasons: 2006–07, 2004–05
- South Pacific cyclone seasons: 2003–04, 2004–05
- South-West Indian Ocean cyclone seasons: 2003–04, 2003–04
- Atlantic hurricane season
Notes
[edit]References
[edit]- ^ a b William M. Gray; Philip J. Klotzbach (December 5, 2003). "Extended Range Forecast of Atlantic Seasonal Hurricane Activity and US Landfall Strike Probability for 2004". Colorado State University. Colorado State University. Retrieved December 3, 2013.
- ^ a b "Atlantic hurricane best track (HURDAT version 2)" (Database). United States National Hurricane Center. April 5, 2023. Retrieved December 20, 2024.
 This article incorporates text from this source, which is in the public domain.
- Landsea, Chris (April 2022). "The revised Atlantic hurricane database (HURDAT2) - Chris Landsea – April 2022" (PDF). Hurricane Research Division – NOAA/AOML. Miami: Hurricane Research Division – via Atlantic Oceanographic and Meteorological Laboratory.
- ^ William M. Gray; Philip J. Klotzbach (April 2, 2004). "Extended Range Forecast of Atlantic Seasonal Hurricane Activity and US Landfall Strike Probability for 2004". Colorado State University. Colorado State University. Retrieved December 3, 2013.
- ^ "Above-normal 2004 Atlantic hurricane season expected". National Oceanic and Atmospheric Administration. National Oceanic and Atmospheric Administration. May 17, 2004. Retrieved December 3, 2013.
- ^ William M. Gray; Philip J. Klotzbach (May 28, 2004). "Extended Range Forecast of Atlantic Seasonal Hurricane Activity and US Landfall Strike Probability for 2004". Colorado State University. Colorado State University. Retrieved December 3, 2013.
- ^ William M. Gray; Philip J. Klotzbach (August 6, 2004). "Extended Range Forecast of Atlantic Seasonal Hurricane Activity and US Landfall Strike Probability for 2004". Colorado State University. Colorado State University. Retrieved December 3, 2013.
- ^ William M. Gray; Philip J. Klotzbach (September 3, 2004). "Forecast of Atlantic Seasonal Hurricane Activity and US Landfall Strike Probability for 2004". Colorado State University. Colorado State University. Retrieved December 3, 2013.
- ^ William M. Gray; Philip J. Klotzbach (October 1, 2004). "Extended Range Forecast of Atlantic Seasonal Hurricane Activity and US Landfall Strike Probability for 2004". Colorado State University. Colorado State University. Retrieved December 3, 2013.
- ^ James L. Franklin (August 1, 2004). Tropical Weather Summary: June. National Hurricane Center (Report). National Oceanic and Atmospheric Administration. Retrieved December 14, 2013.
- ^ Miles B. Lawrence; et al. (September 1, 2004). Tropical Weather Summary: June. National Hurricane Center (Report). National Oceanic and Atmospheric Administration. Retrieved December 14, 2013.
{{cite report}}: Explicit use of et al. in:|author=(help) - ^ Stacy R. Stewart (November 19, 2004). Tropical Cyclone Report: Hurricane Danielle (PDF). National Hurricane Center (Report). National Oceanic and Atmospheric Administration. Retrieved December 3, 2013.
- ^ Miles B. Lawrence (November 25, 2004). Tropical Cyclone Report: Tropical Storm Earl (PDF). National Hurricane Center (Report). National Oceanic and Atmospheric Administration. Retrieved December 3, 2013.
- ^ "Report on Tropical Storm Earl". Grenada Today. Grenada Today. August 28, 2004. Retrieved December 3, 2013.
- ^ Loren Brown (August 16, 2004). "Tropical Storm Earl Hits Caribbean Isles". Associated Press. HighBeam Research. Retrieved December 3, 2013.
- ^ Aurelia Zanetti; et al. (2005). Natural catastrophes and man-made disasters in 2004 (PDF). Swiss Re (Report). Swiss Re. Retrieved December 3, 2013.
{{cite report}}: Explicit use of et al. in:|author=(help) - ^ a b Lixion A. Avila (November 17, 2004). Tropical Cyclone Report: Tropical Storm Hermine (PDF). National Hurricane Center (Report). National Oceanic and Atmospheric Administration. Retrieved December 8, 2013.
- ^ 2004-Hermine. Environment Canada (Report). Environment Canada. September 14, 2010. Retrieved December 8, 2013.
- ^ Richard J. Pasch (November 21, 2004). Tropical Cyclone Report: Tropical Depression Ten (PDF). National Hurricane Center (Report). National Oceanic and Atmospheric Administration. Retrieved December 3, 2013.
- ^ Stacy R. Stewart (December 7, 2004). Tropical Cyclone Report: Tropical Storm Otto (PDF). National Hurricane Center (Report). National Oceanic and Atmospheric Administration. Retrieved December 8, 2013.


