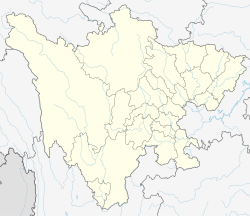
Xindu, Chengdu
Xindu
新都区 | |
|---|---|
| District of Xindu, City of Chengdu | |
 Location of Xindu in Chengdu | |
| Coordinates: 30°48′45″N 104°10′25″E / 30.8125°N 104.1735°E[1] | |
| Country | China |
| Province | Sichuan |
| Sub-provincial city | Chengdu |
| District seat | Guihu Subdistrict |
| Area | |
• Total | 497 km2 (192 sq mi) |
| Population (2020 census)[2] | |
• Total | 1,558,466 |
| • Density | 3,100/km2 (8,100/sq mi) |
| Time zone | UTC+8 (China Standard) |
| Postal code | 6105XX |
Xindu District (Chinese: 新都区; pinyin: Xīndū Qū; lit. 'new metropolis district') is a district of the City of Chengdu, capital of Sichuan, China. It covers part of the city's northern suburbs.
Overview
[edit]The Xindu District borders the prefecture-level city of Deyang to the north. The population of the district is 600,000, residing in an area of 481 square kilometres (186 sq mi), only 32.6 km2 (12.6 sq mi) of which is part of the city's urban area. Xindu District was founded as an administrative district in 2001. It is a historical and cultural region encompassing 13 towns and 255 villages.
The Sichuan Conservatory of Music and the associated Chengdu Academy of Fine Arts have a campus here.[3]
Nicknames
[edit]Xindu District is known as the "Tianfu Pearl" (天府明珠) and "Fragrant City" (香城).
Administrative divisions
[edit]Xindu District administers 7 subdistricts and 2 towns:[4]
- Dafeng Subdistrict 大丰街道
- Sanhe Subdistrict 三河街道
- Xindu Subdistrict 新都街道
- Xinfan Subdistrict 新繁街道
- Shibantan Subdistrict 石板滩街道
- Banzhuyuan Subdistrict 斑竹园街道
- Guihu Subdistrict 桂湖街道
- Qingliu Town 清流镇
- Juntun Town 军屯镇
Climate
[edit]| Climate data for Xindu, elevation 515 m (1,690 ft), (1991–2020 normals, extremes 1981–2010) | |||||||||||||
|---|---|---|---|---|---|---|---|---|---|---|---|---|---|
| Month | Jan | Feb | Mar | Apr | May | Jun | Jul | Aug | Sep | Oct | Nov | Dec | Year |
| Record high °C (°F) | 18.7 (65.7) |
23.1 (73.6) |
31.6 (88.9) |
35.5 (95.9) |
36.3 (97.3) |
35.8 (96.4) |
37.0 (98.6) |
37.3 (99.1) |
36.1 (97.0) |
30.3 (86.5) |
26.1 (79.0) |
18.4 (65.1) |
37.3 (99.1) |
| Mean daily maximum °C (°F) | 9.5 (49.1) |
12.5 (54.5) |
17.4 (63.3) |
23.2 (73.8) |
27.1 (80.8) |
29.0 (84.2) |
30.5 (86.9) |
30.3 (86.5) |
26.1 (79.0) |
21.1 (70.0) |
16.4 (61.5) |
10.9 (51.6) |
21.2 (70.1) |
| Daily mean °C (°F) | 5.9 (42.6) |
8.5 (47.3) |
12.7 (54.9) |
17.9 (64.2) |
21.9 (71.4) |
24.5 (76.1) |
26.1 (79.0) |
25.6 (78.1) |
22.0 (71.6) |
17.5 (63.5) |
12.7 (54.9) |
7.4 (45.3) |
16.9 (62.4) |
| Mean daily minimum °C (°F) | 3.3 (37.9) |
5.7 (42.3) |
9.3 (48.7) |
13.9 (57.0) |
17.9 (64.2) |
21.1 (70.0) |
22.7 (72.9) |
22.3 (72.1) |
19.3 (66.7) |
15.1 (59.2) |
10.1 (50.2) |
4.9 (40.8) |
13.8 (56.8) |
| Record low °C (°F) | −4.1 (24.6) |
−2.7 (27.1) |
−1.9 (28.6) |
4.1 (39.4) |
5.7 (42.3) |
14.5 (58.1) |
16.5 (61.7) |
15.7 (60.3) |
12.7 (54.9) |
2.6 (36.7) |
0.7 (33.3) |
−4.6 (23.7) |
−4.6 (23.7) |
| Average precipitation mm (inches) | 7.8 (0.31) |
9.7 (0.38) |
20.4 (0.80) |
41.8 (1.65) |
66.8 (2.63) |
109.1 (4.30) |
195.1 (7.68) |
200.3 (7.89) |
110.5 (4.35) |
38.9 (1.53) |
14.1 (0.56) |
5.6 (0.22) |
820.1 (32.3) |
| Average precipitation days (≥ 0.1 mm) | 6.9 | 7.1 | 10.3 | 12.0 | 13.1 | 14.6 | 16.1 | 14.6 | 14.5 | 13.7 | 6.7 | 5.4 | 135 |
| Average snowy days | 1.3 | 0.4 | 0 | 0 | 0 | 0 | 0 | 0 | 0 | 0 | 0.1 | 0.3 | 2.1 |
| Average relative humidity (%) | 80 | 77 | 74 | 73 | 70 | 76 | 82 | 82 | 82 | 82 | 81 | 81 | 78 |
| Mean monthly sunshine hours | 48.8 | 53.8 | 85.6 | 112.5 | 117.4 | 105.2 | 121.3 | 130.6 | 71.2 | 56.5 | 58.8 | 44.2 | 1,005.9 |
| Percent possible sunshine | 15 | 17 | 23 | 29 | 28 | 25 | 28 | 32 | 19 | 16 | 19 | 14 | 22 |
| Source: China Meteorological Administration[5][6] | |||||||||||||
References
[edit]- ^ "Xindu" (Map). Google Maps. Retrieved 2014-07-02.
- ^ "China: Sìchuān (Prefectures, Cities, Districts and Counties) - Population Statistics, Charts and Map". www.citypopulation.de. Retrieved 2024-11-20.
- ^ "Chengdu Academy of Fine Arts". China: Sichuan Conservatory of Music. Retrieved 23 November 2021.
- ^ 2023年统计用区划代码和城乡划分代码:新都区 (in Simplified Chinese). National Bureau of Statistics of China.
- ^ 中国气象数据网 – WeatherBk Data (in Simplified Chinese). China Meteorological Administration. Retrieved 14 April 2023.
- ^ 中国气象数据网 (in Simplified Chinese). China Meteorological Administration. Retrieved 14 April 2023.

